Fig. 4
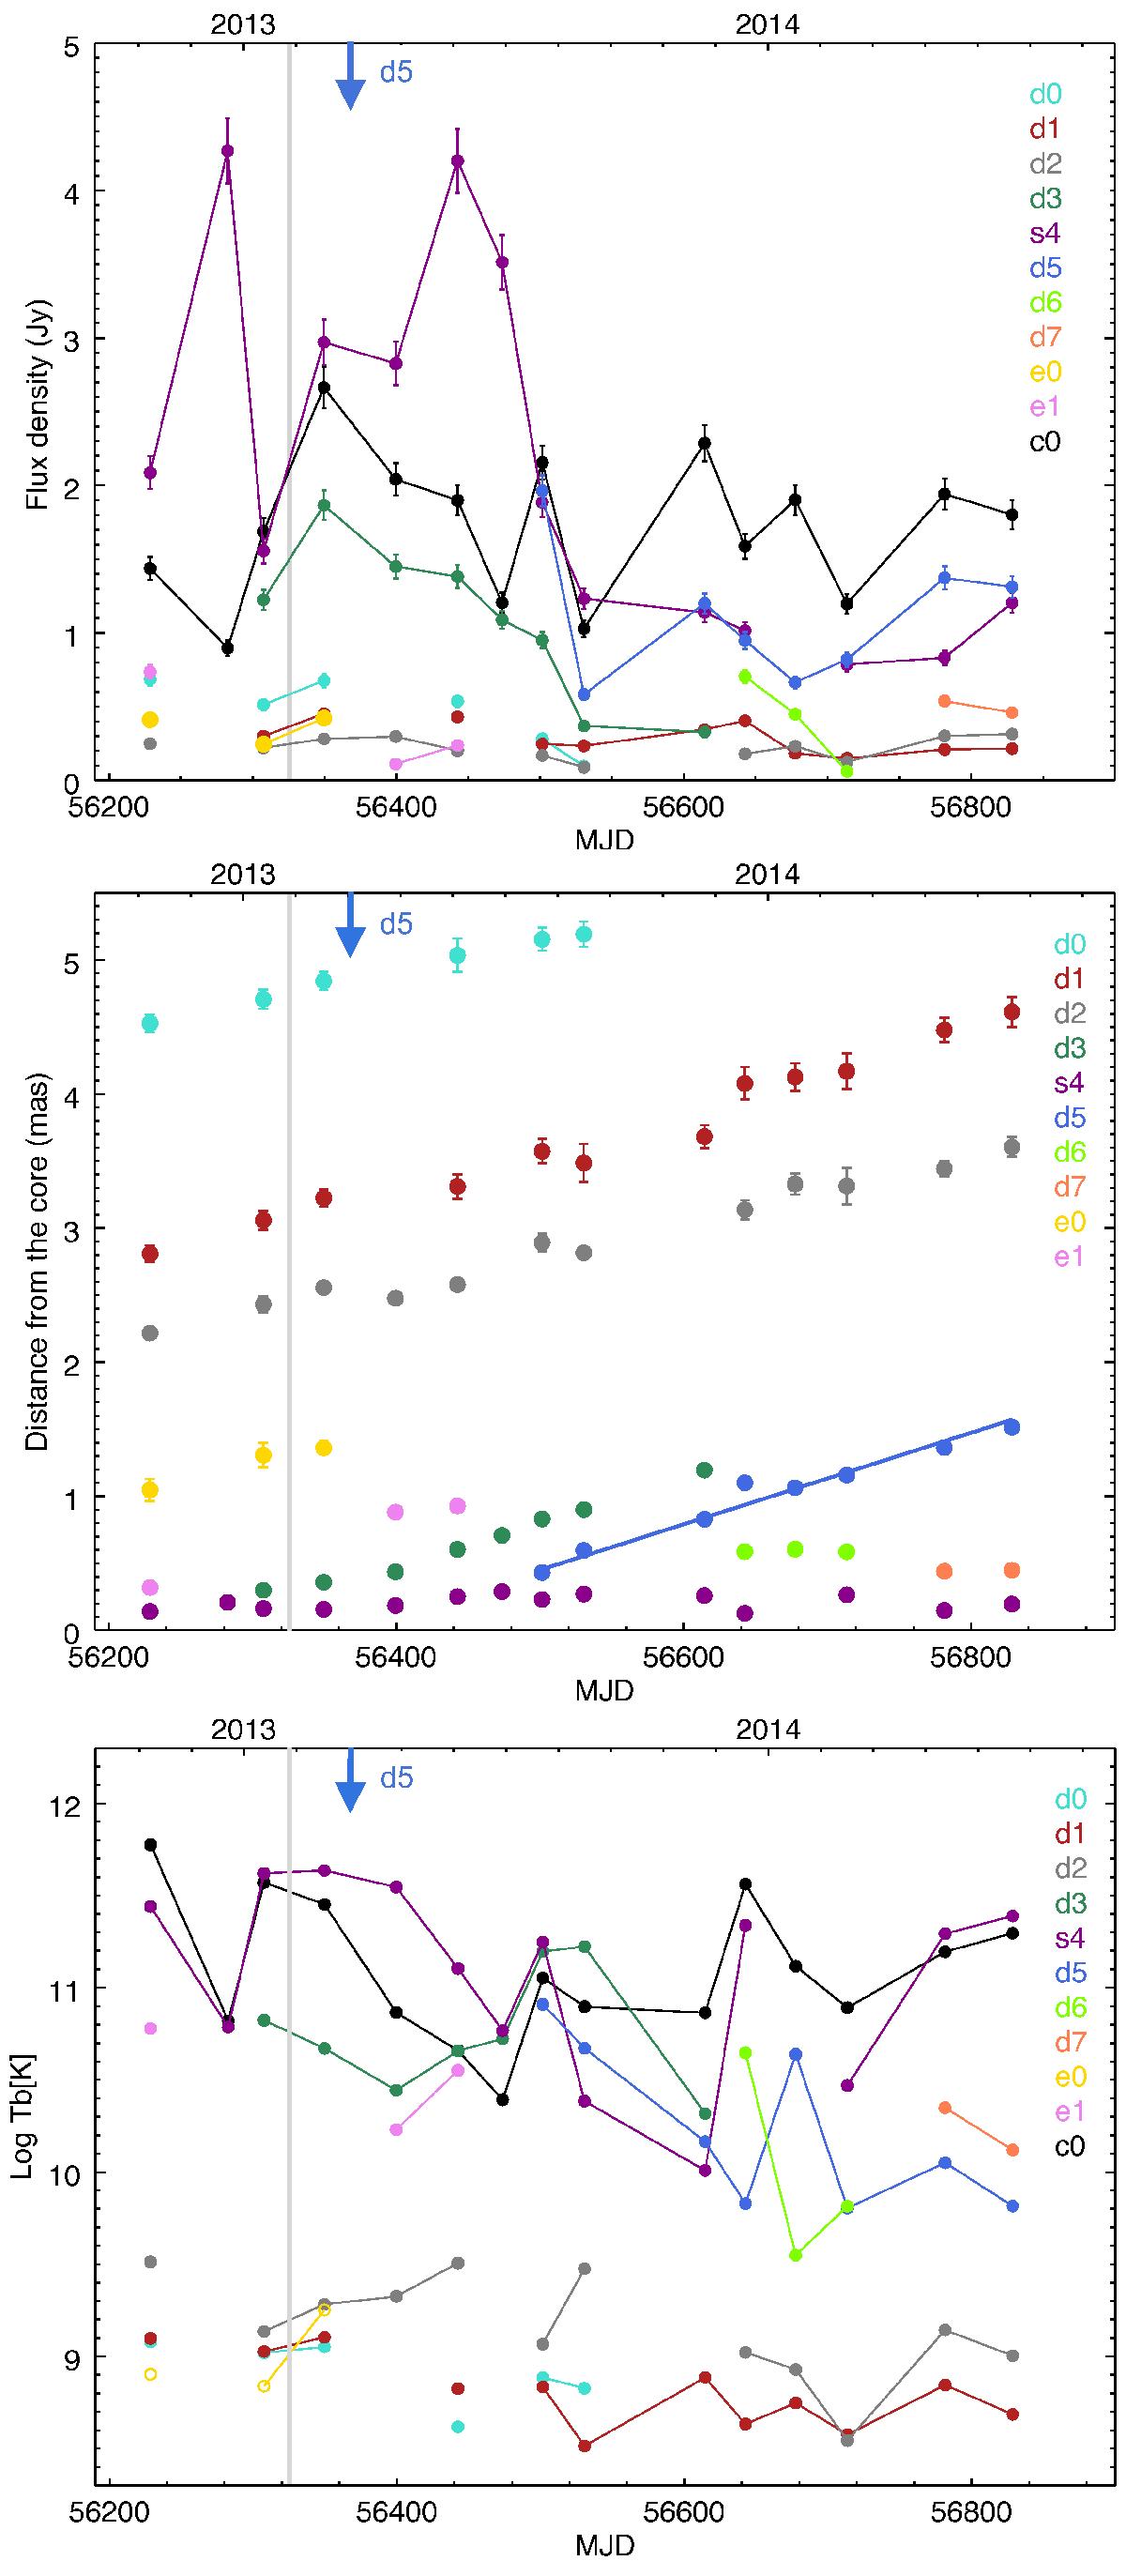
Results from the 43 GHz VLBA-BU-BLAZAR data from 2012−2014, for each modelfit component. The gray vertical line indicates the Kovalev et al. (2016) epoch and the arrow indicates the ejection epoch for component d5. Top panel: light curves; middle panel: distance from the core versus time; d5 is the radio component ejected after the Kovalev et al. (2016) epoch; bottom panel: observed brightness temperature versus time.
Current usage metrics show cumulative count of Article Views (full-text article views including HTML views, PDF and ePub downloads, according to the available data) and Abstracts Views on Vision4Press platform.
Data correspond to usage on the plateform after 2015. The current usage metrics is available 48-96 hours after online publication and is updated daily on week days.
Initial download of the metrics may take a while.