Fig. 3
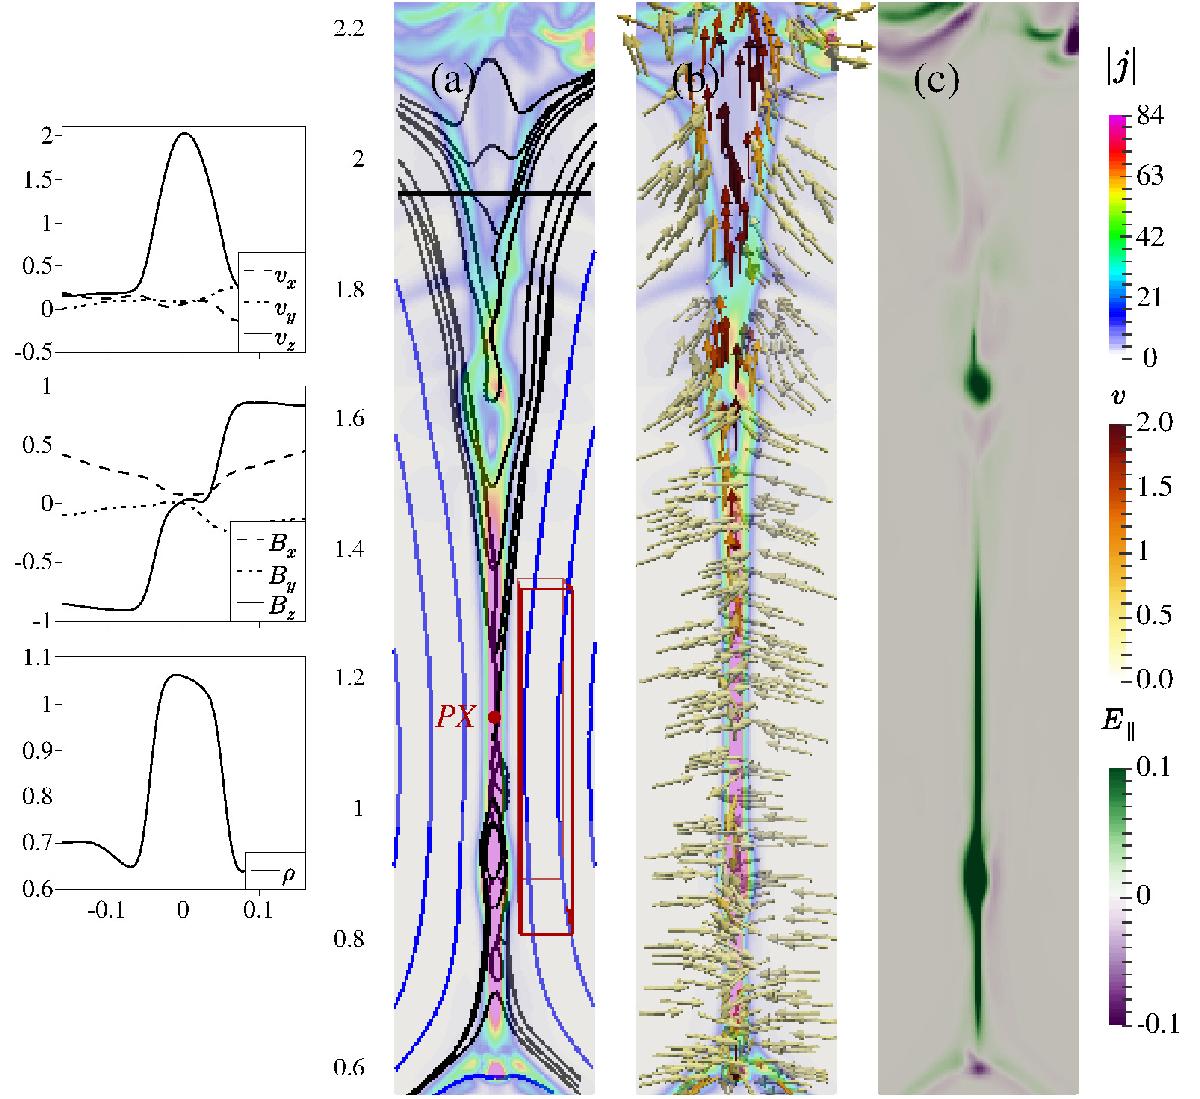
Fine structures inside the current sheet (CS) at t = 9.6. a) Current distribution on the cut y = 0; magnetic field lines passing through points uniformly distributed on the z-axis (black lines) and outside the CS (blue lines). The inserts on the left side give the variation of physical quantities along the line marked on this panel. A red point PX and a red box are marked for the evaluation of reconnection rates. b) Distributions of plasma velocity (arrows) in the vicinity of the CS. c) Distribution of parallel electric field ![]() .
.
Current usage metrics show cumulative count of Article Views (full-text article views including HTML views, PDF and ePub downloads, according to the available data) and Abstracts Views on Vision4Press platform.
Data correspond to usage on the plateform after 2015. The current usage metrics is available 48-96 hours after online publication and is updated daily on week days.
Initial download of the metrics may take a while.