Free Access
Fig. 2
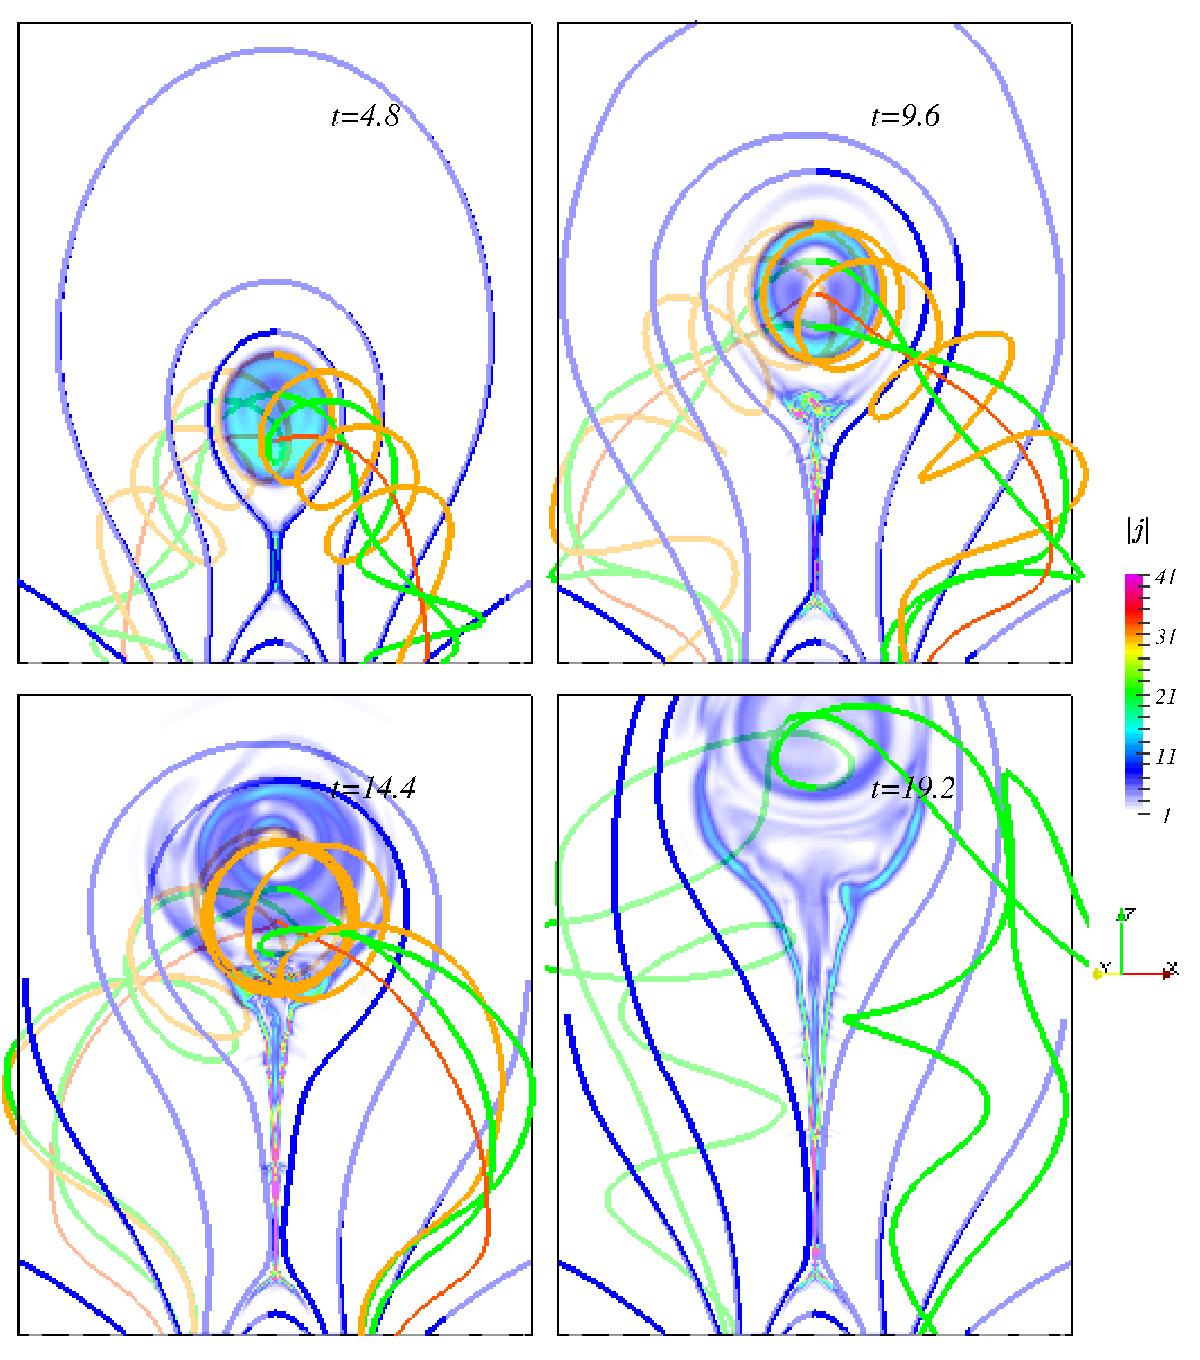
Evolution snapshots of MFR at different times. Coloured curves are magnetic field lines outside and inside the MFR (blue and green) and on the surface of the MFR (orange). Translucent colours illustrate the current distribution on the cut y = 0. An animation for MFR evolution is available online.
Current usage metrics show cumulative count of Article Views (full-text article views including HTML views, PDF and ePub downloads, according to the available data) and Abstracts Views on Vision4Press platform.
Data correspond to usage on the plateform after 2015. The current usage metrics is available 48-96 hours after online publication and is updated daily on week days.
Initial download of the metrics may take a while.