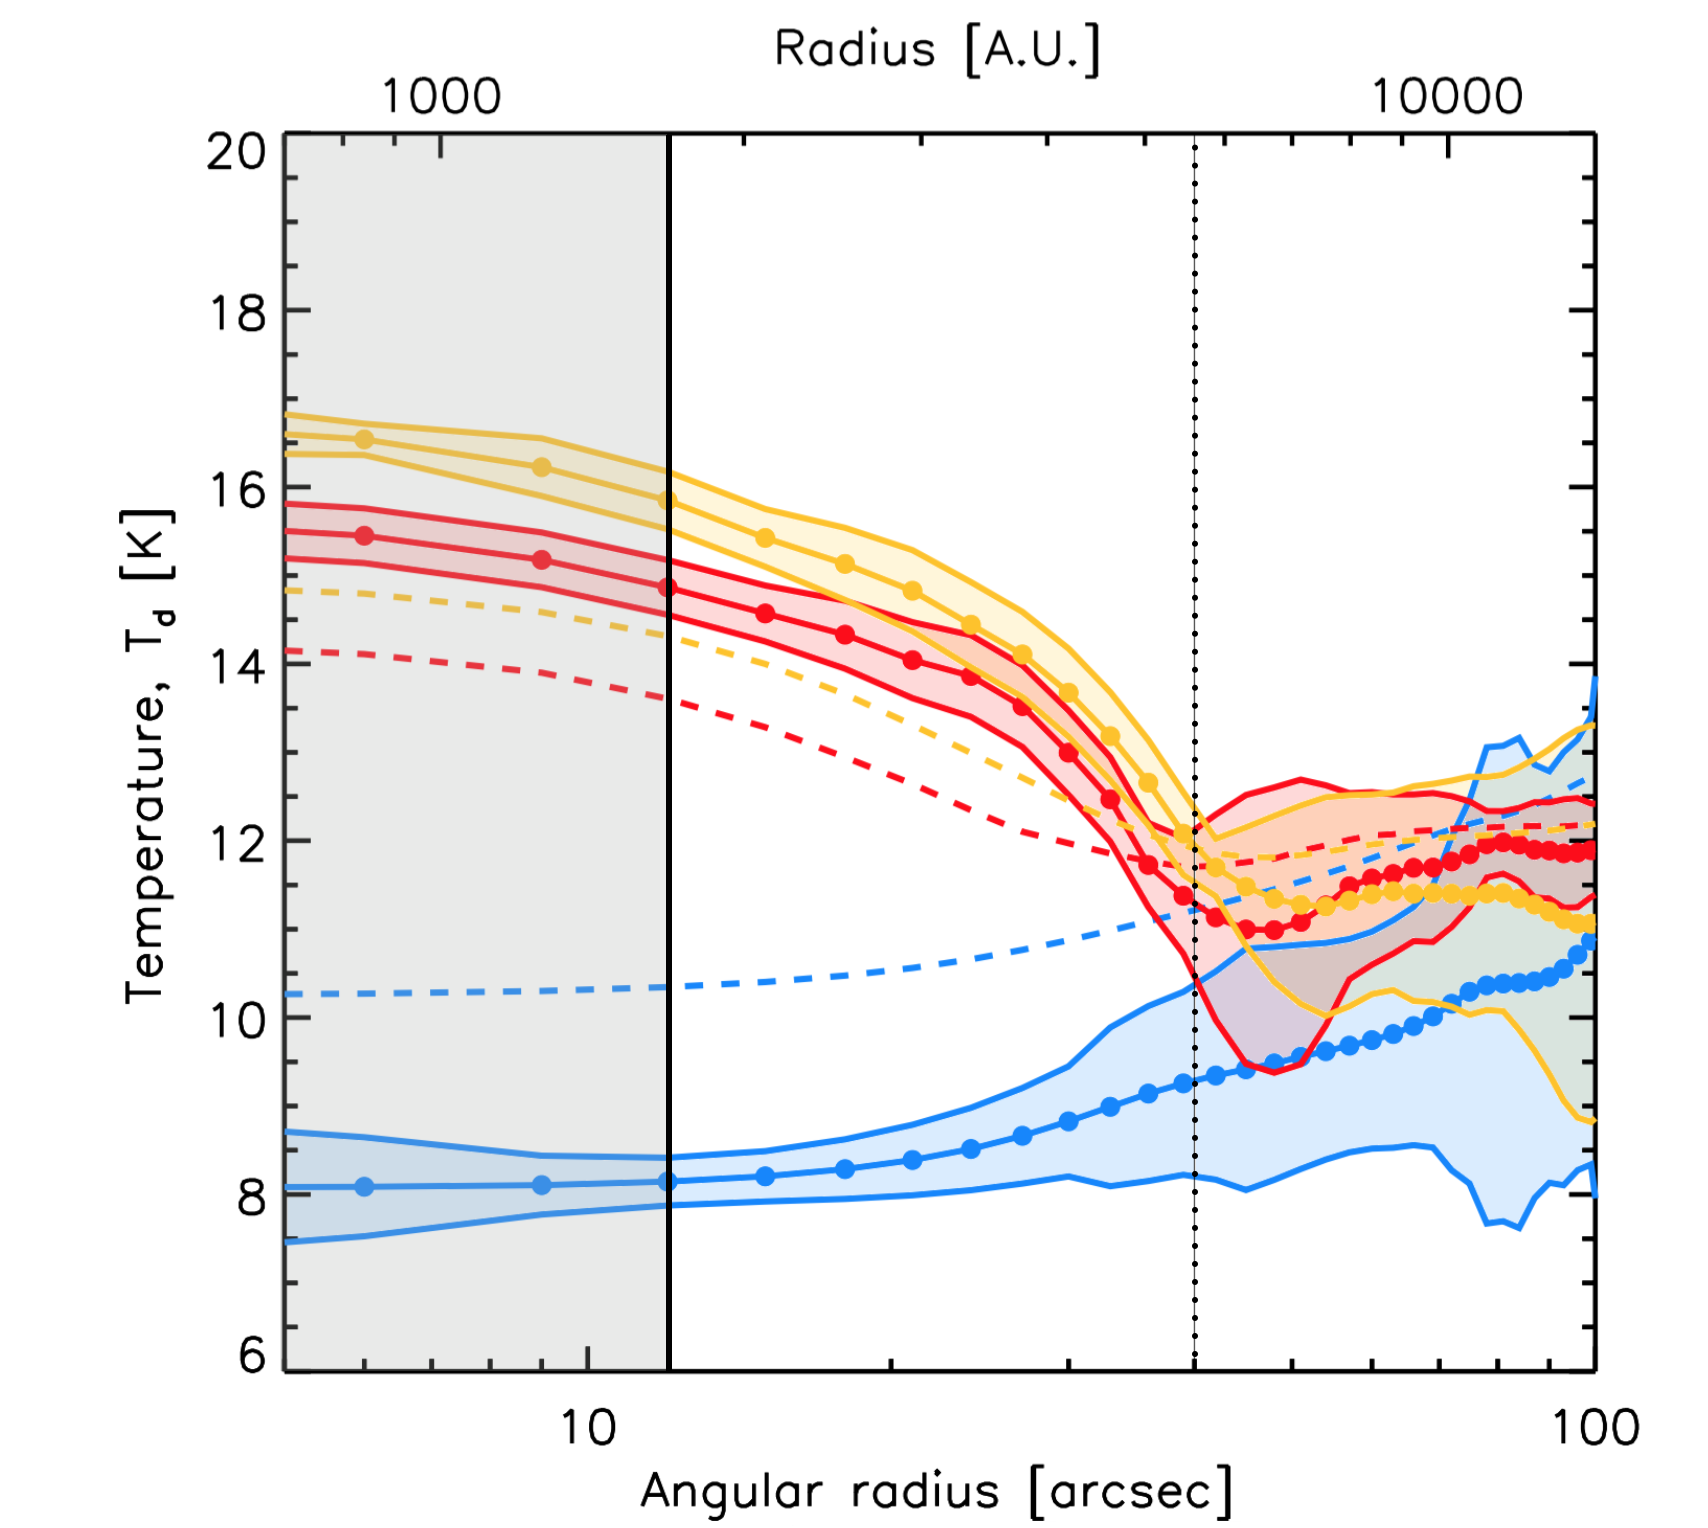
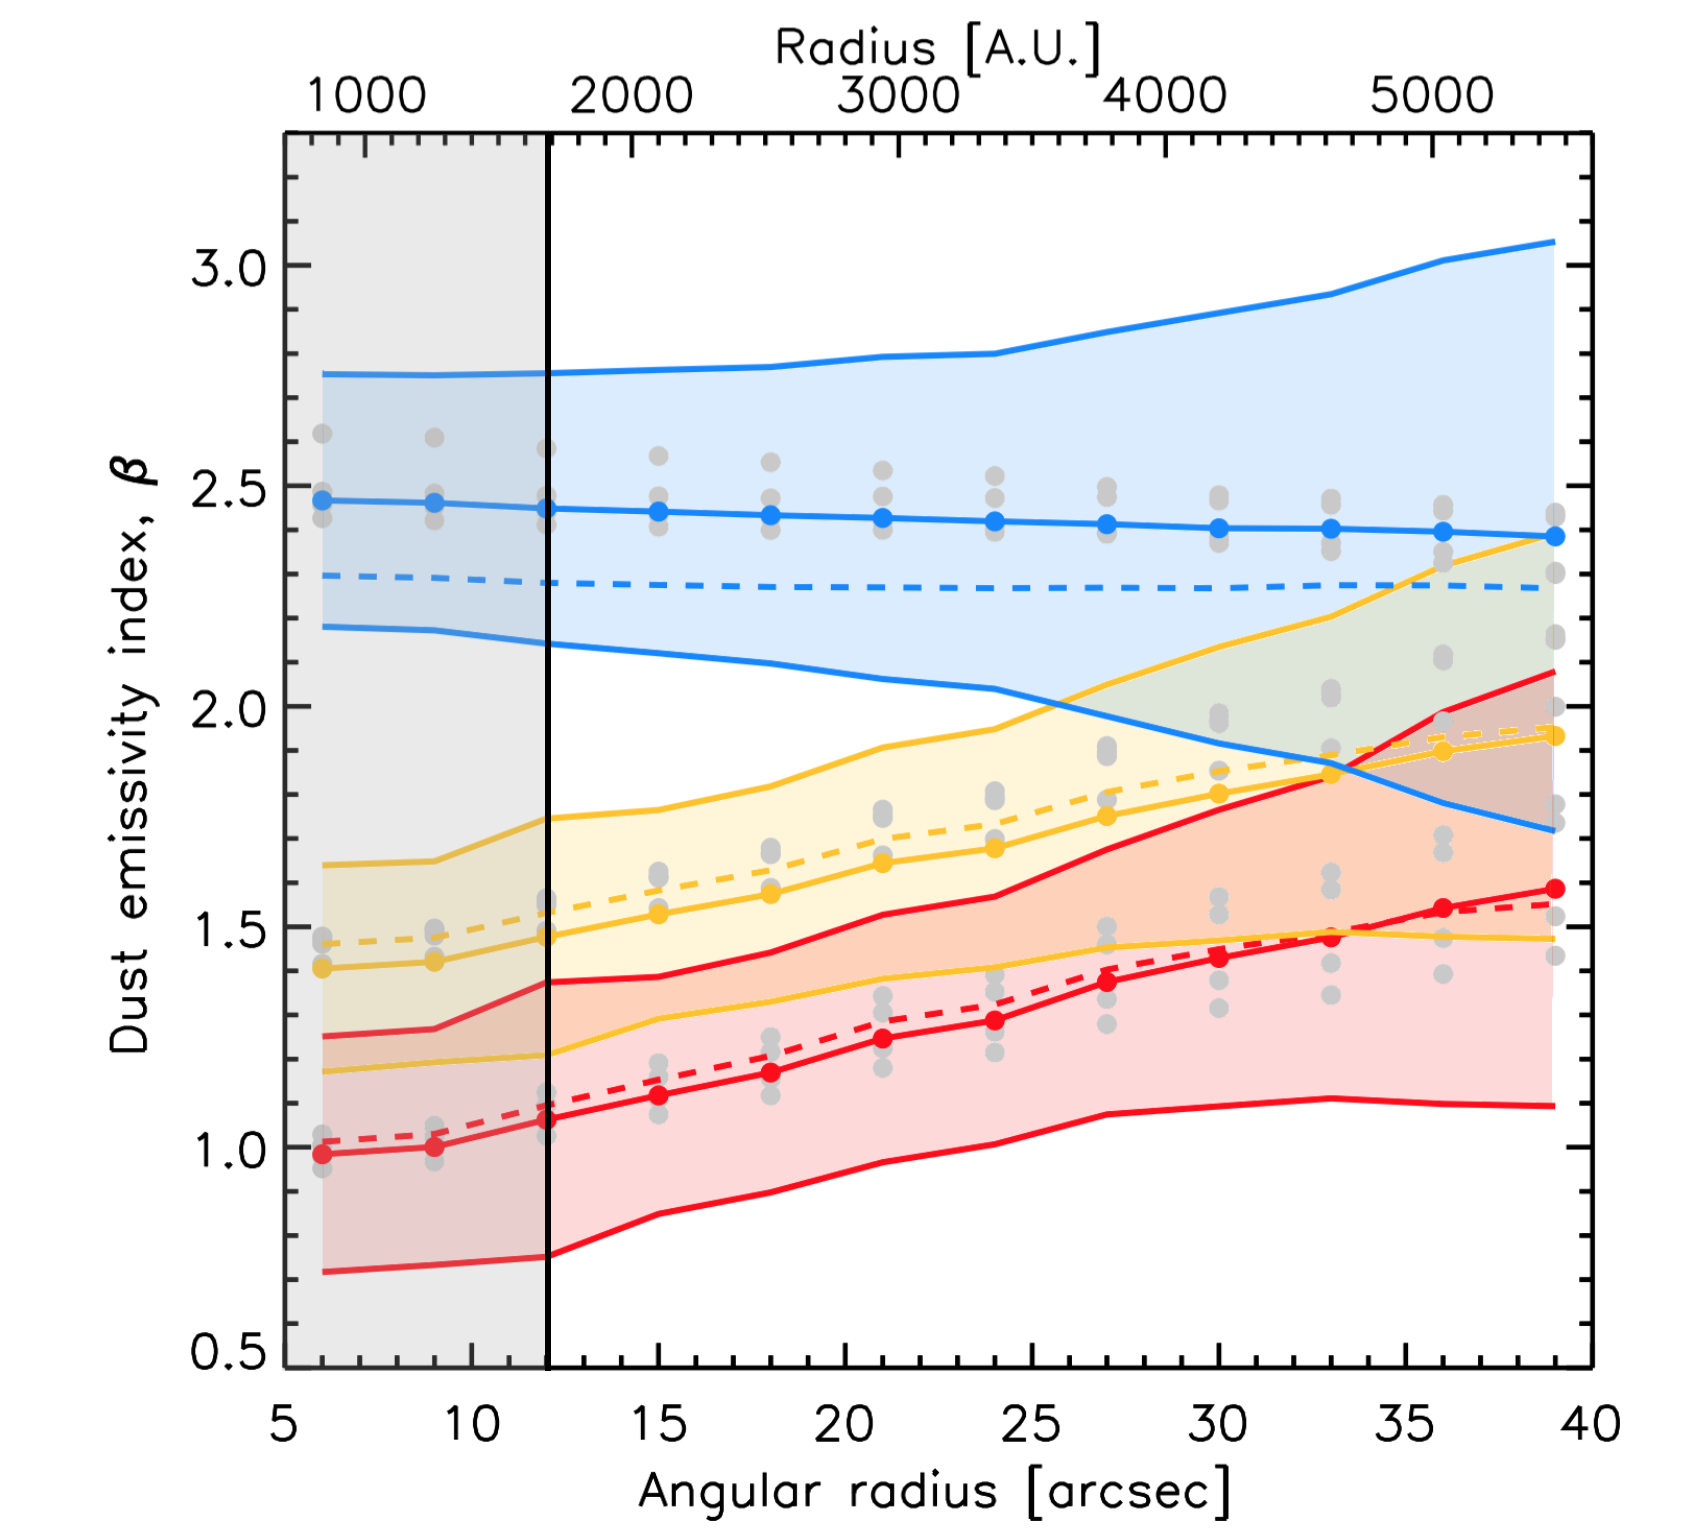
Fig. 5
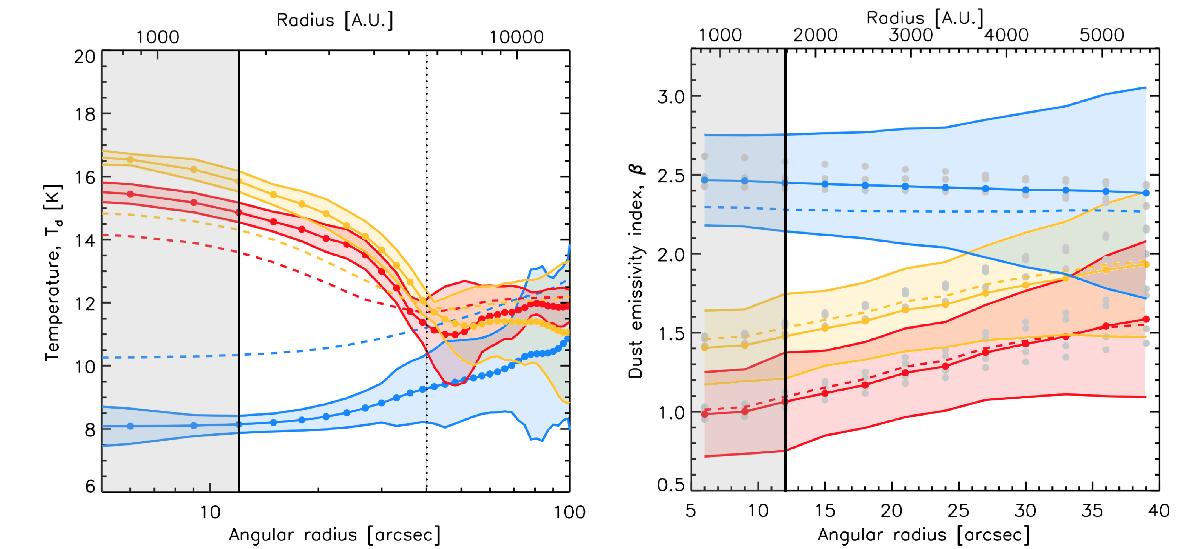
Left: dust temperature radial profiles of K04166 (red), K04169 (yellow), and Miz-8b (blue). The dust temperatures were derived from Herschel Gould Belt survey data1. The dashed colored lines correspond to line-of-sight averaged temperatures obtained from direct SED fitting, while dots and solid lines correspond to Abel-reconstructed dust temperatures. The colored shades represent the 1σ errors of the Abel-reconstructed temperatures. Right: radial profiles of β using the Abel-reconstructed temperatures. The color-code is the same as in the left panel. The gray dots show the β profiles corresponding to four different versions of the maps used to quantify systematic effects due to spatial filtering in the data. The gray-shaded area in both panels indicates radial distances below the half-beam width of 12″. The Abel transform is only performed for radial distances smaller than the dotted black vertical line in the left panel. On the upper x-axis the radial distance is in astronomical units assuming a distance of 140 pc for the Taurus molecular cloud.
Current usage metrics show cumulative count of Article Views (full-text article views including HTML views, PDF and ePub downloads, according to the available data) and Abstracts Views on Vision4Press platform.
Data correspond to usage on the plateform after 2015. The current usage metrics is available 48-96 hours after online publication and is updated daily on week days.
Initial download of the metrics may take a while.