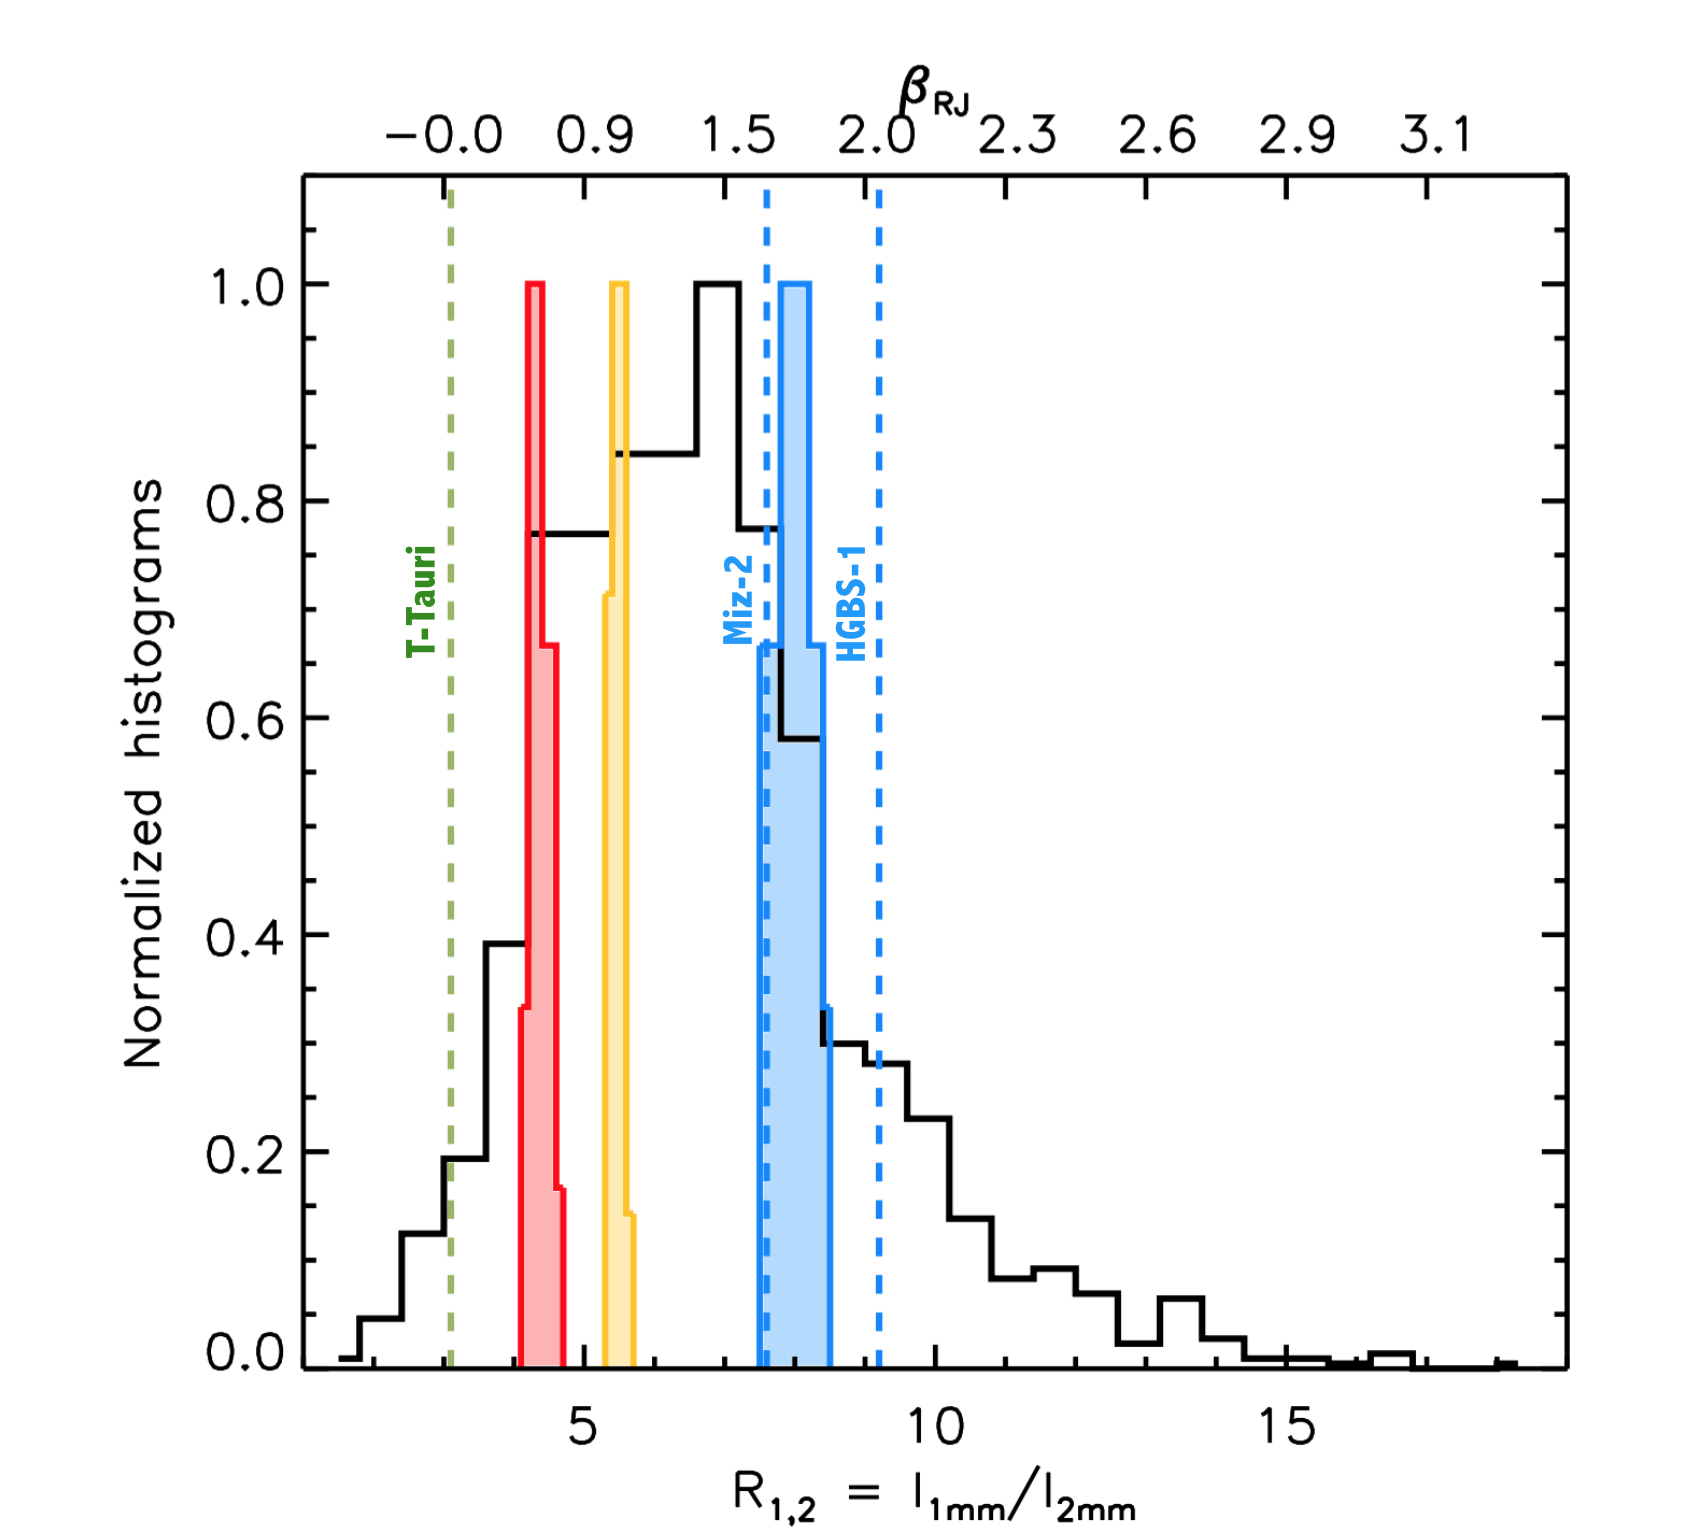
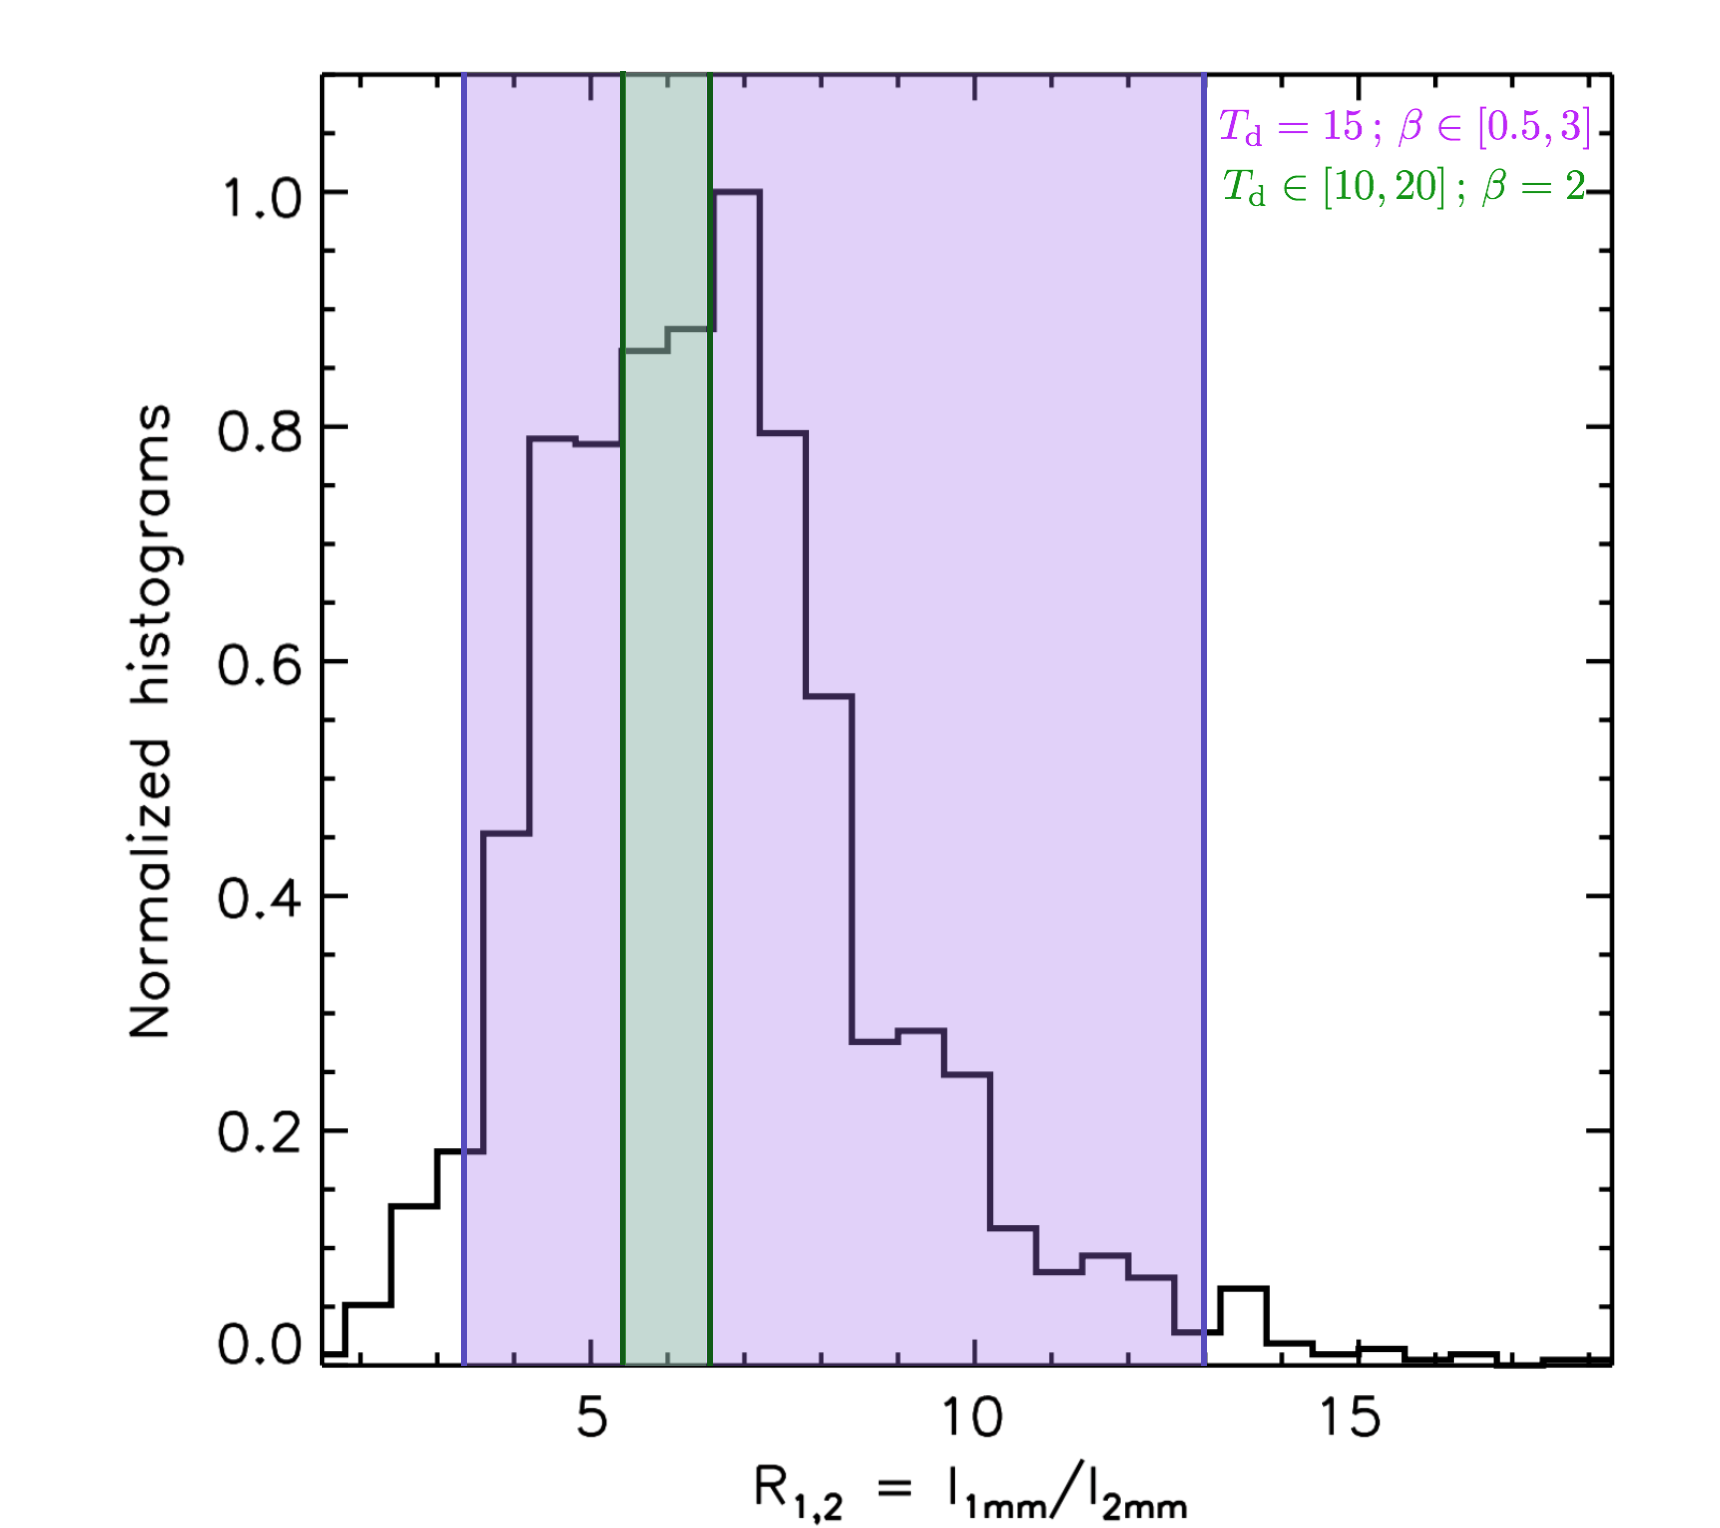
Fig. 4
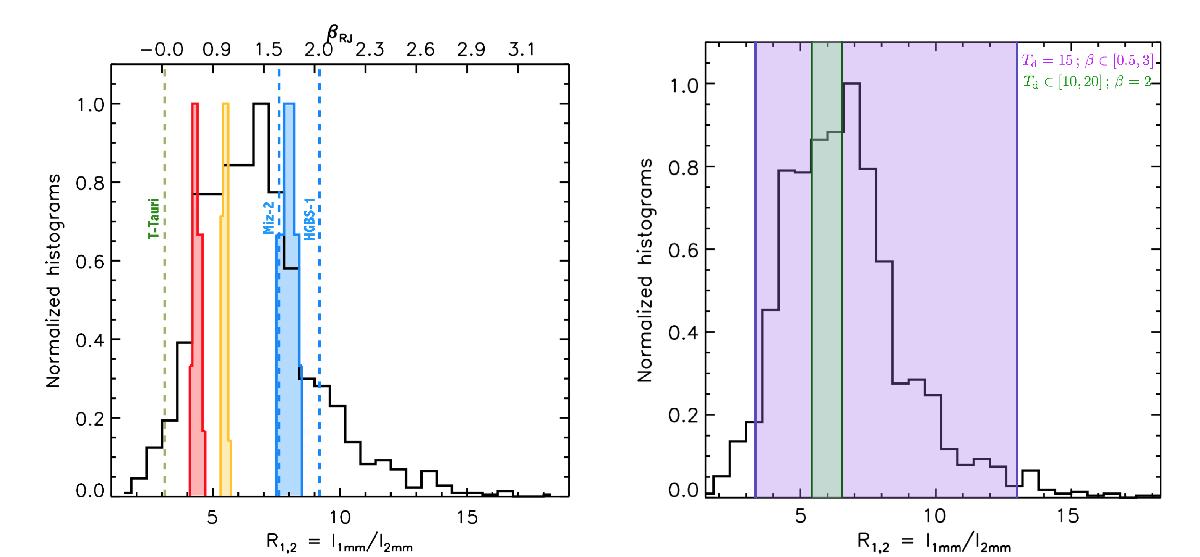
Left: normalized histogram of R1,2 in black for all the unmasked pixels in the maps. The colored normalized histograms represent the R1,2 distributions within one-beam area (24″) around the central coordinates (see Table 1) of K04166 (red), K04169 (yellow), and Miz-8b (blue). The vertical dashed lines refer to the value of the ratio at the peak-intensity position of T Tauri (green), Miz-2, and HGBS-1 (blue). The upper x-axis shows the corresponding β values in the Rayleigh-Jeans limit (see Sect. 5.1). Right: same as in the left panel with shades that now represent ranges of R1,2 corresponding to graybodies with 1) a constant temperature Td of 15 K but a varying β between 0.5 and 3 in purple; 2) a constant β of 2, but varying Td between 10 K and 20 K in green.
Current usage metrics show cumulative count of Article Views (full-text article views including HTML views, PDF and ePub downloads, according to the available data) and Abstracts Views on Vision4Press platform.
Data correspond to usage on the plateform after 2015. The current usage metrics is available 48-96 hours after online publication and is updated daily on week days.
Initial download of the metrics may take a while.