Fig. 3
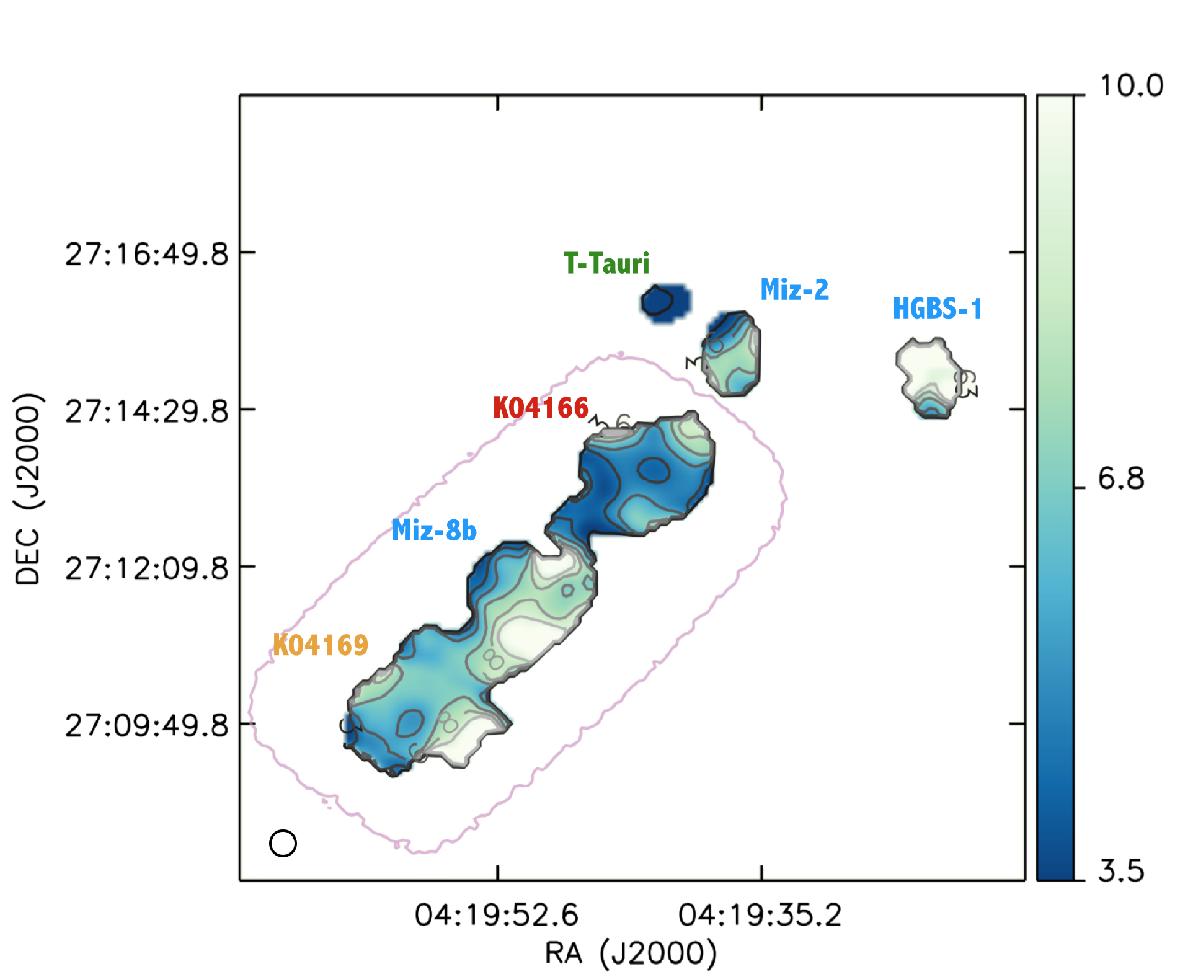
Ratio map between the two NIKA bands, ![]() . The unmasked region corresponds to a signal-to-noise ratio on the fluxes above 10 at both wavelengths. Black contours represent R1,2 equal to 3, 4.5, 5.6, 7, 8, and 9. The purple contour corresponds to the part of the field with homogeneous observing time >240 s per pixel (see Fig. A.1). The open circle in the bottom left corner represents the beam size (24″).
. The unmasked region corresponds to a signal-to-noise ratio on the fluxes above 10 at both wavelengths. Black contours represent R1,2 equal to 3, 4.5, 5.6, 7, 8, and 9. The purple contour corresponds to the part of the field with homogeneous observing time >240 s per pixel (see Fig. A.1). The open circle in the bottom left corner represents the beam size (24″).
Current usage metrics show cumulative count of Article Views (full-text article views including HTML views, PDF and ePub downloads, according to the available data) and Abstracts Views on Vision4Press platform.
Data correspond to usage on the plateform after 2015. The current usage metrics is available 48-96 hours after online publication and is updated daily on week days.
Initial download of the metrics may take a while.