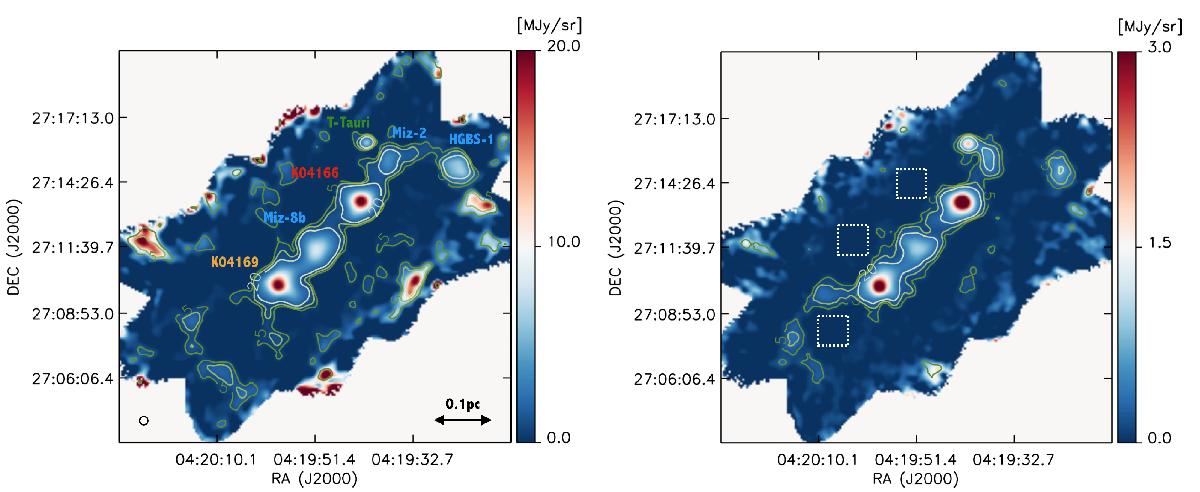
Fig. 1

Dust continuum maps of a portion of the B213 filament obtained with the NIKA camera on the IRAM 30 m telescope at 1.15 mm (left panel) and 2 mm (right panel). The two maps are shown after smoothing to a common resolution of 24′′ (see the circle in the bottom-left corner of the left panel). The green contours represent the signal-to-noise ratio levels (5, 10, 20) at each wavelength. The labels in the left panel correspond to the sources analyzed in this work, which are listed in Table 1. The three squares on the right delimit the regions where we estimate the rms intensity of the two maps at 24′′, which corresponds to 0.75 MJy/sr and 0.09 MJy/sr at 1.15 mm and 2 mm respectively.
Current usage metrics show cumulative count of Article Views (full-text article views including HTML views, PDF and ePub downloads, according to the available data) and Abstracts Views on Vision4Press platform.
Data correspond to usage on the plateform after 2015. The current usage metrics is available 48-96 hours after online publication and is updated daily on week days.
Initial download of the metrics may take a while.


