Fig. 9
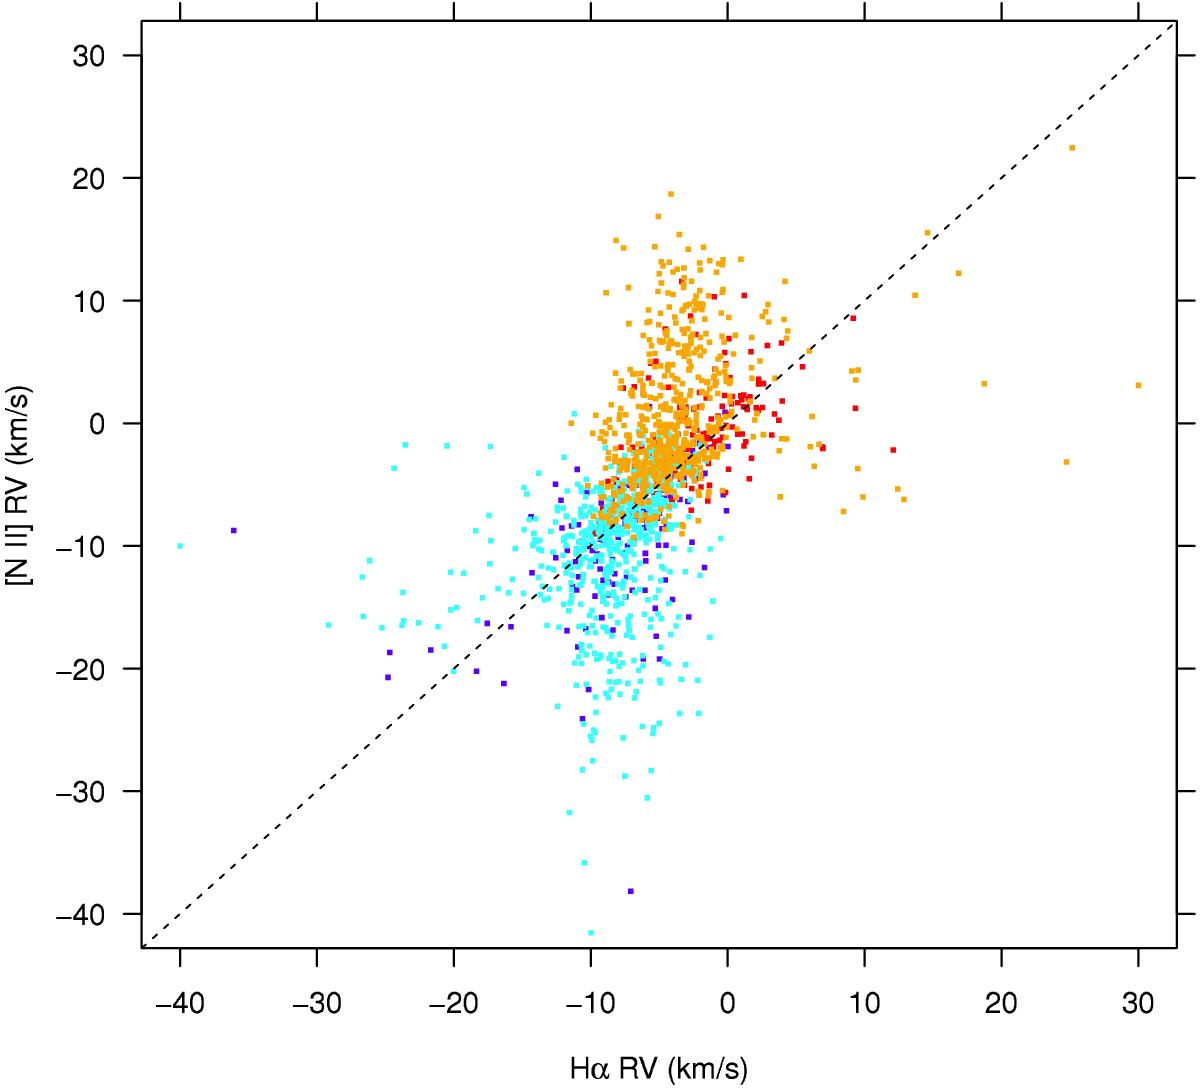
Comparison between RVs of Hα and [N II] 2-g fits. The results of each individual spectrum are plotted twice, once for the red Hα and [N II] components, and again for the blue components of the same lines. Blue and red dots refer to blue and red components from sky fibres, while cyan and orange dots refer to the same components from faint stars.
Current usage metrics show cumulative count of Article Views (full-text article views including HTML views, PDF and ePub downloads, according to the available data) and Abstracts Views on Vision4Press platform.
Data correspond to usage on the plateform after 2015. The current usage metrics is available 48-96 hours after online publication and is updated daily on week days.
Initial download of the metrics may take a while.