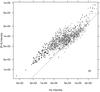
Fig. 5
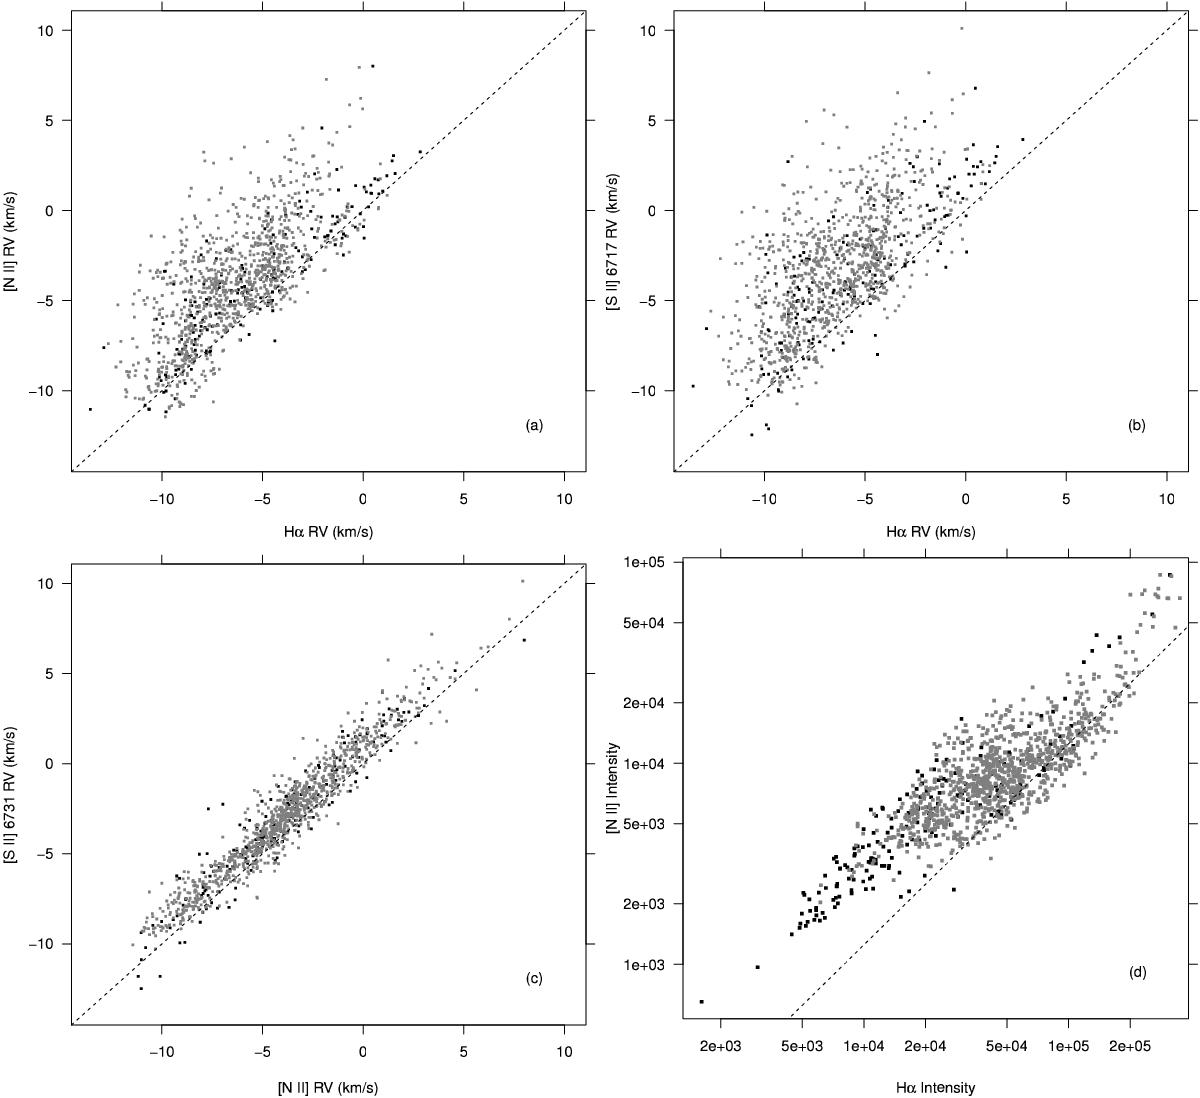
a) Comparison between 1-g best-fit RVs from Hα and [N II] 6584 lines. Black dots indicate pure-sky fibres while gray dots indicate faint stars. The dashed line indicates identity. b) Same comparison as in panel a, between Hα and [S II] 6731. c) Same comparison as in panel a, between [N II] 6584 and [S II] 6731. d) Comparison between intensities of Hα and [N II] 6584, as resulting from 1-g models. Symbols as in panel a. The dashed line represents a ratio of 1/8.
Current usage metrics show cumulative count of Article Views (full-text article views including HTML views, PDF and ePub downloads, according to the available data) and Abstracts Views on Vision4Press platform.
Data correspond to usage on the plateform after 2015. The current usage metrics is available 48-96 hours after online publication and is updated daily on week days.
Initial download of the metrics may take a while.