Fig. 31
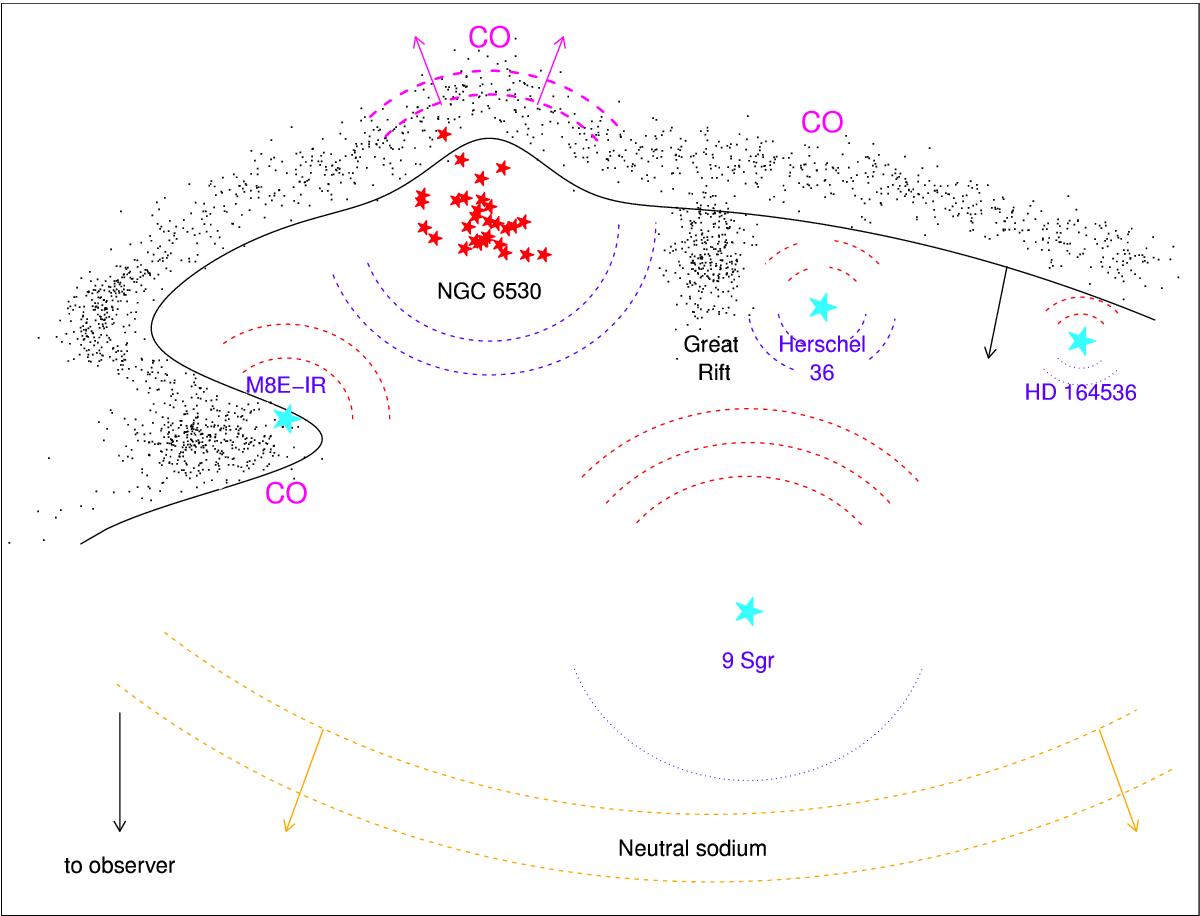
Schematic representation of the Lagoon nebula geometry, along a direction passing through M 8E-IR and the Hourglass nebula. The black line indicates the molecular cloud boundary. Dusty regions are indicated with dots. Red (blue) dashed arcs indicate redshifted (blueshifted) ionized gas. Triple arcs indicate more conspicuous emission, single arcs weak emission; broken arcs indicate irregular shells. The position and motion of the known CO clouds is indicated in magenta. The most massive stars and the NGC 6530 cluster core are indicated with cyan and red stars respectively. The large-scale sodium layers are also shown (yellow dashed lines), probably not to scale.
Current usage metrics show cumulative count of Article Views (full-text article views including HTML views, PDF and ePub downloads, according to the available data) and Abstracts Views on Vision4Press platform.
Data correspond to usage on the plateform after 2015. The current usage metrics is available 48-96 hours after online publication and is updated daily on week days.
Initial download of the metrics may take a while.