Free Access
Fig. 29
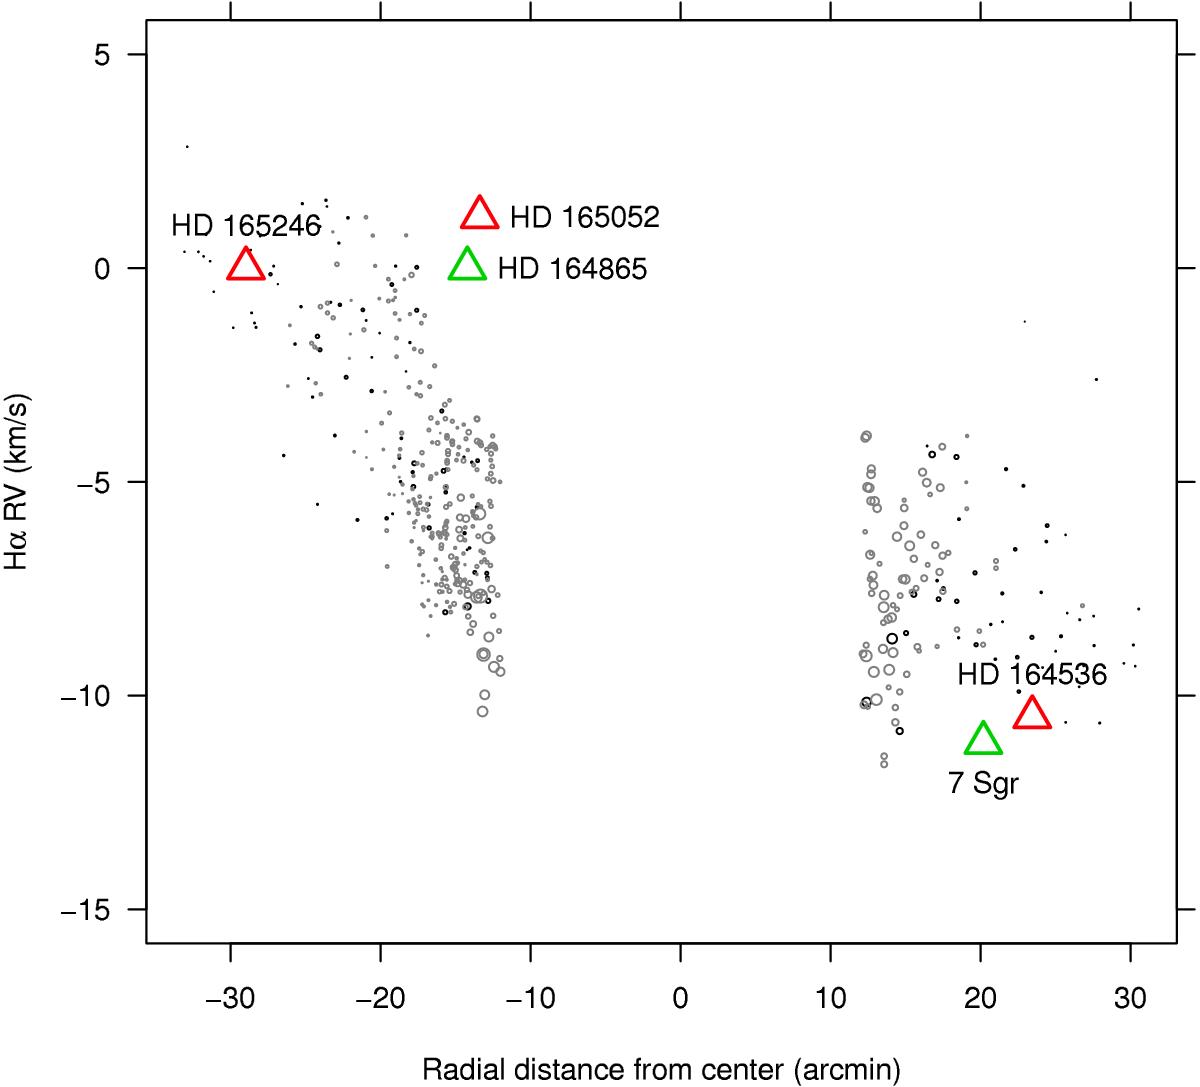
Large-scale RV dependence on radius, from Hα (1-g fits). Only datapoints external to the cluster-core region (red dashed circle in Fig. 16) are shown. The abscissae show radial distances from cluster center (red plus sign in Fig. 16), shown separately for the eastern (left) and western (right) parts. Symbols as in Fig. 22.
Current usage metrics show cumulative count of Article Views (full-text article views including HTML views, PDF and ePub downloads, according to the available data) and Abstracts Views on Vision4Press platform.
Data correspond to usage on the plateform after 2015. The current usage metrics is available 48-96 hours after online publication and is updated daily on week days.
Initial download of the metrics may take a while.