Fig. 22
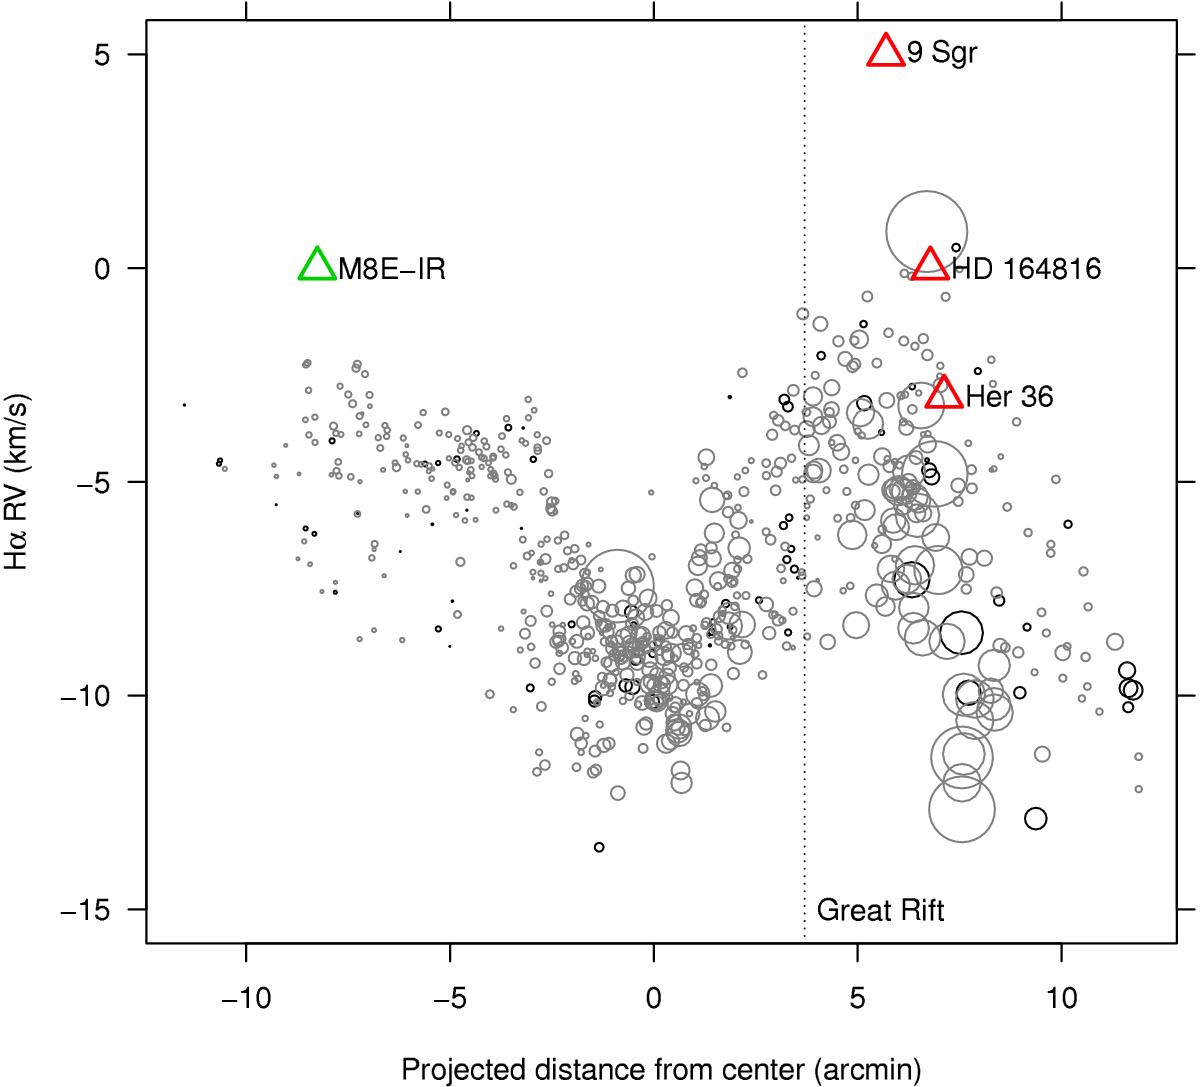
Position-velocity diagram for Hα, inside the cluster core region (red dashed circle in Fig. 16). The projected distances in the abscissae are computed along the direction of the arrow also shown in Fig. 16. RVs from 1-g fits. Symbol size is proportional to line intensity from 1-g fits. Black (gray) circles refer to pure-sky (faint-star) fibres. The O star HD 164816 and the massive object M 8E-IR (triangles), for which no RV measurements are available, are plotted at RV = 0, that is the NGC 6530 cluster velocity, while the other triangles indicate massive-star RVs as reported in Table 1.
Current usage metrics show cumulative count of Article Views (full-text article views including HTML views, PDF and ePub downloads, according to the available data) and Abstracts Views on Vision4Press platform.
Data correspond to usage on the plateform after 2015. The current usage metrics is available 48-96 hours after online publication and is updated daily on week days.
Initial download of the metrics may take a while.