Fig. 2
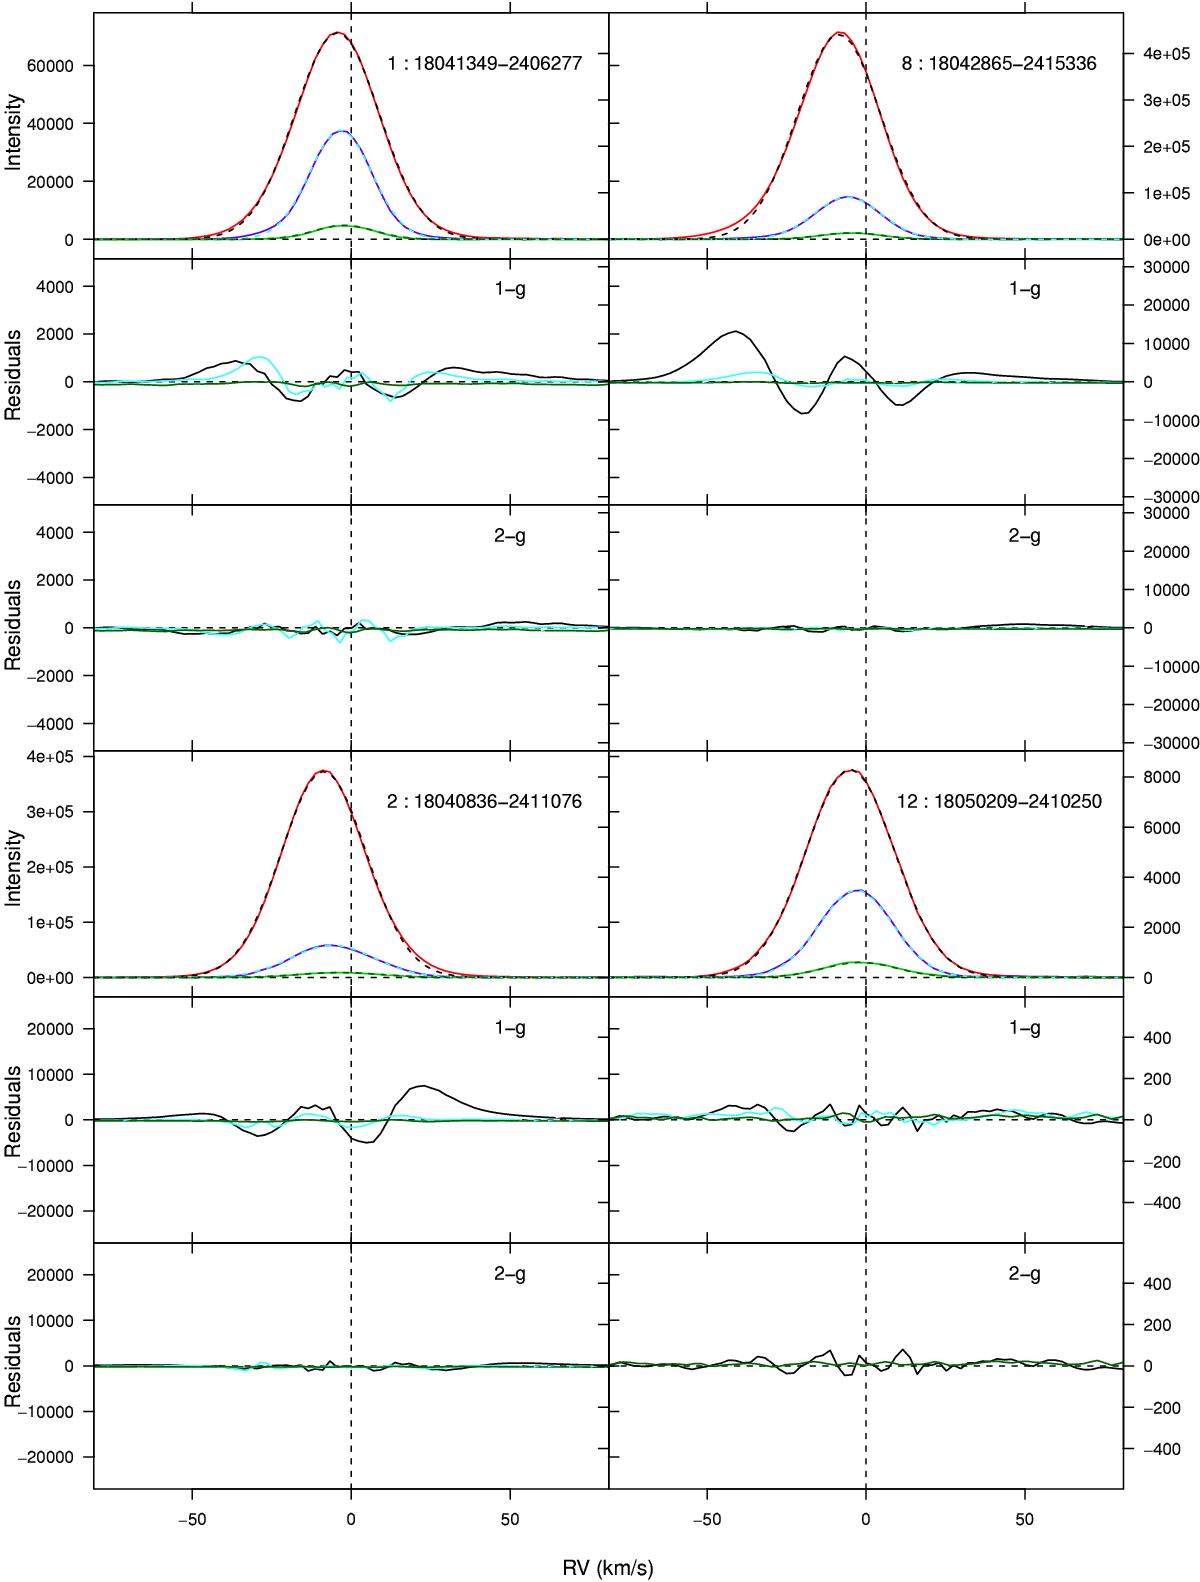
Four examples of nebular line profiles of Hα (red), [N II] 6584 (blue), and [S II] 6731 (green) lines, and their best-fit models using both one- and two-Gaussian models (black, cyan and dark-green dashed lines, for Hα, [N II] and [S II] respectively). The ordinate scale is the same for all lines. Only pure-sky spectra from Giraffe are shown. Each panel labeled with sky position shows the observed spectrum with superimposed the one-Gaussian best-fit model for each line. Below it, the fit residuals (labeled “1-g”) for the one-Gaussian model are shown, with an ordinate scale enlarged 15 times; still below, the fit residuals for the two-Gaussian model (labeled “2-g”) are shown on the same scale.
Current usage metrics show cumulative count of Article Views (full-text article views including HTML views, PDF and ePub downloads, according to the available data) and Abstracts Views on Vision4Press platform.
Data correspond to usage on the plateform after 2015. The current usage metrics is available 48-96 hours after online publication and is updated daily on week days.
Initial download of the metrics may take a while.