Fig. 18
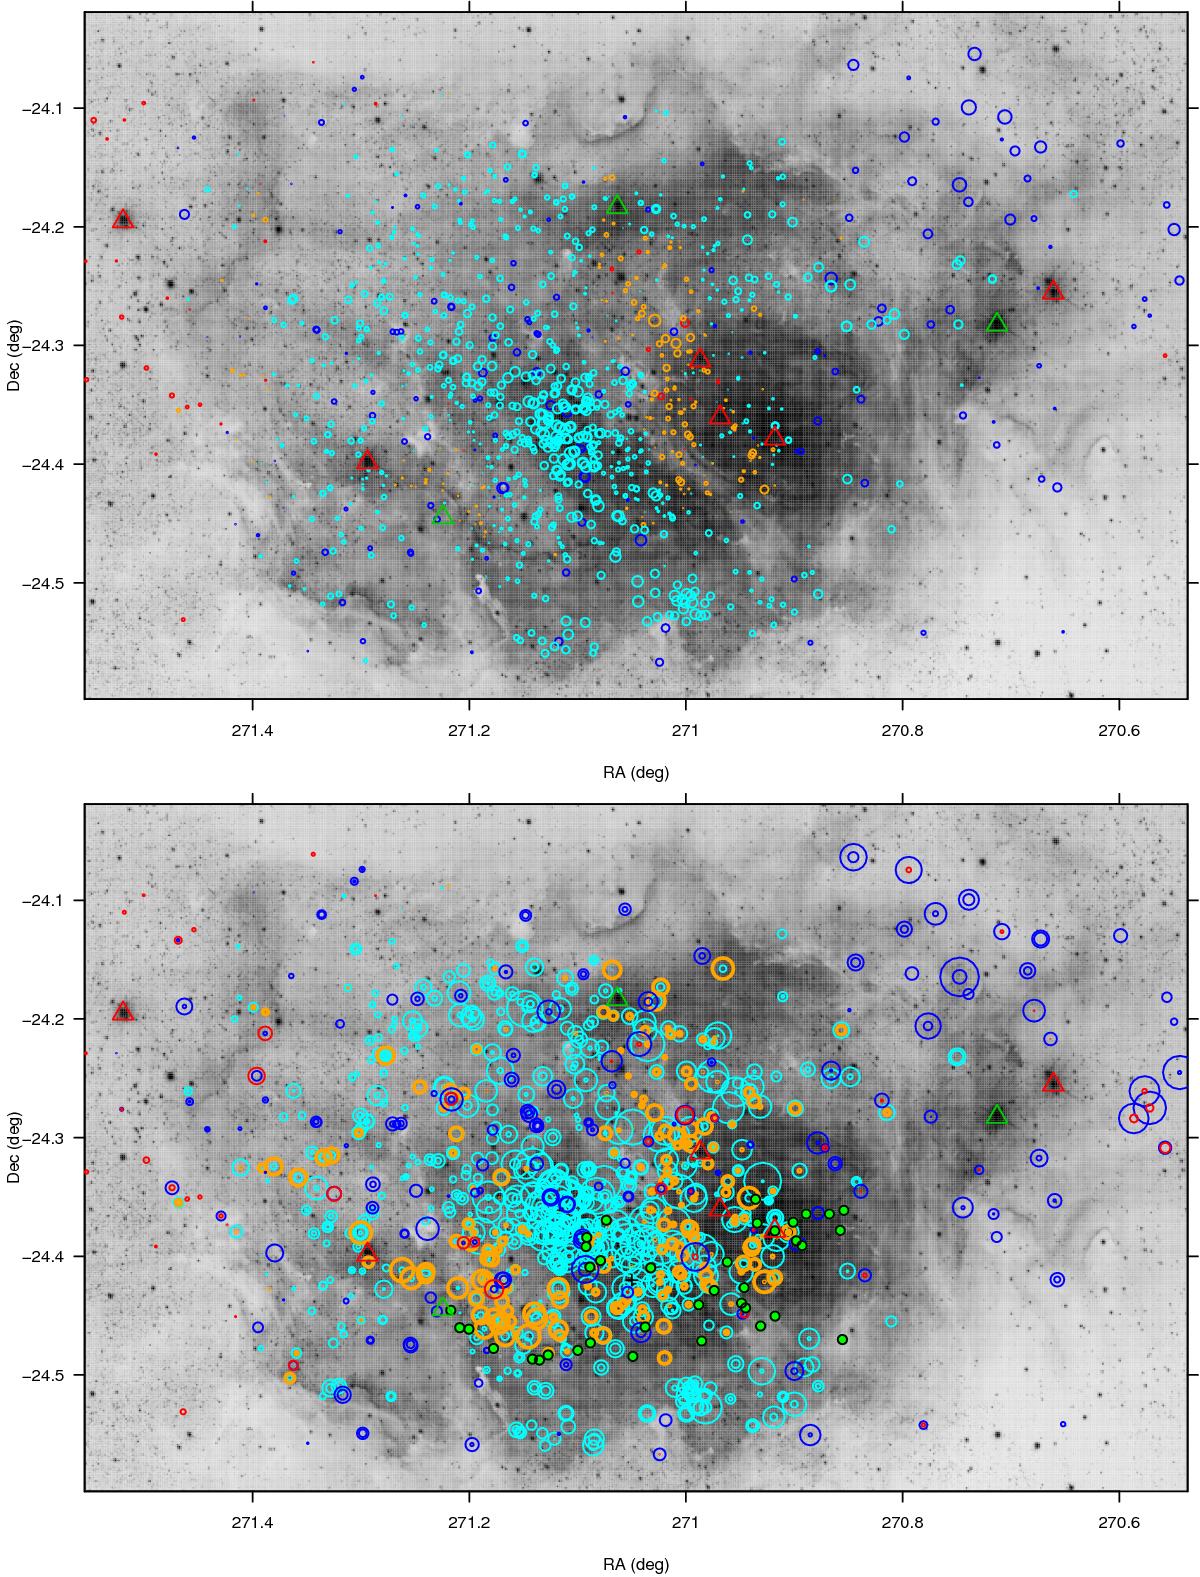
a) (Upper panel) map of [S II] RV from 1-g model fits, analogous to Figs. 16 and 17, with same meaning of symbols. b) (Lower panel) map of [N II] RV (absolute value proportional to circle size) from 2-g model fits. Symbols as in panel a, with the addition of green filled dots indicating the submillimeter clumps found by Tothill et al. (2002). Concentric circles of same color indicate that both RV components have the same sign.
Current usage metrics show cumulative count of Article Views (full-text article views including HTML views, PDF and ePub downloads, according to the available data) and Abstracts Views on Vision4Press platform.
Data correspond to usage on the plateform after 2015. The current usage metrics is available 48-96 hours after online publication and is updated daily on week days.
Initial download of the metrics may take a while.