Fig. 15
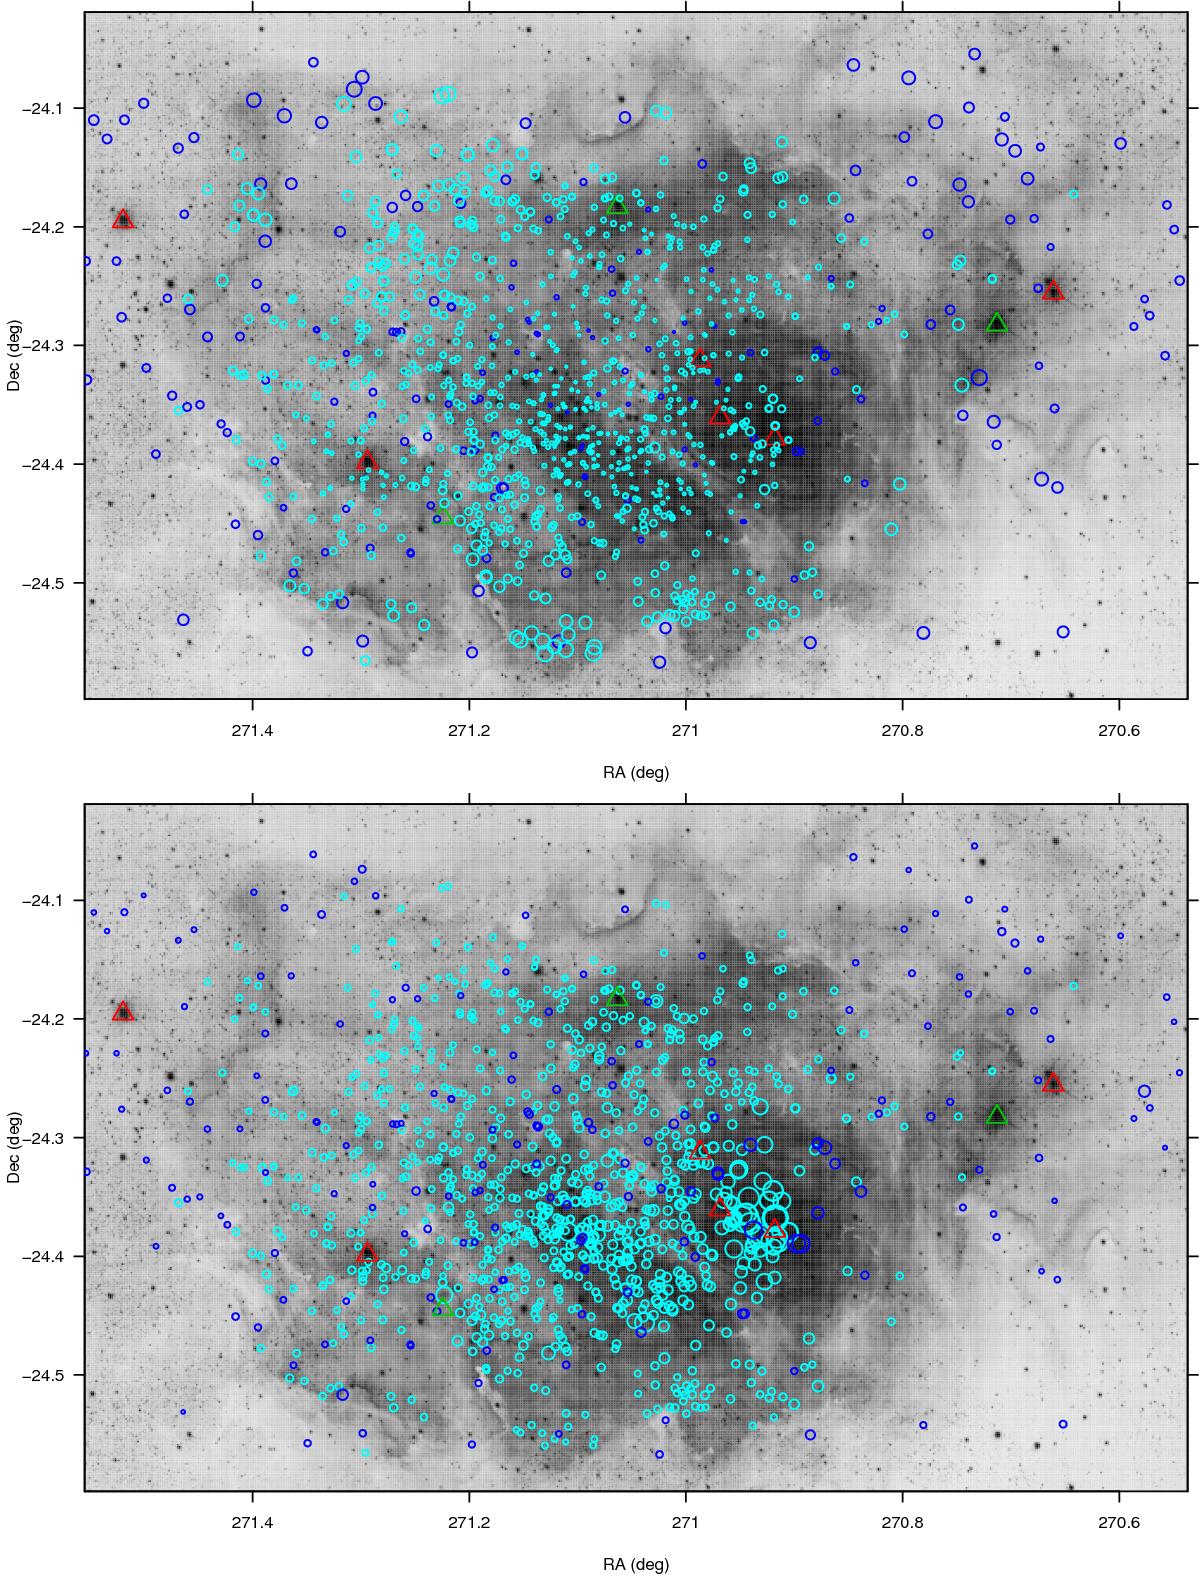
a) (Upper panel) map of intensity ratio between [N II] and Hα (proportional to circle size) from 1-g model fits, superimposed to the same VPHAS+ image as in Fig. 1. Blue (cyan) circles refer to pure-sky (faint star) fibres. Triangles have the same meaning as in Fig. 1. b) (Lower panel) map of [S II] 6731/6717 intensity ratio (proportional to circle size, and increasing with density). Symbols as in panel a.
Current usage metrics show cumulative count of Article Views (full-text article views including HTML views, PDF and ePub downloads, according to the available data) and Abstracts Views on Vision4Press platform.
Data correspond to usage on the plateform after 2015. The current usage metrics is available 48-96 hours after online publication and is updated daily on week days.
Initial download of the metrics may take a while.