Fig. 13
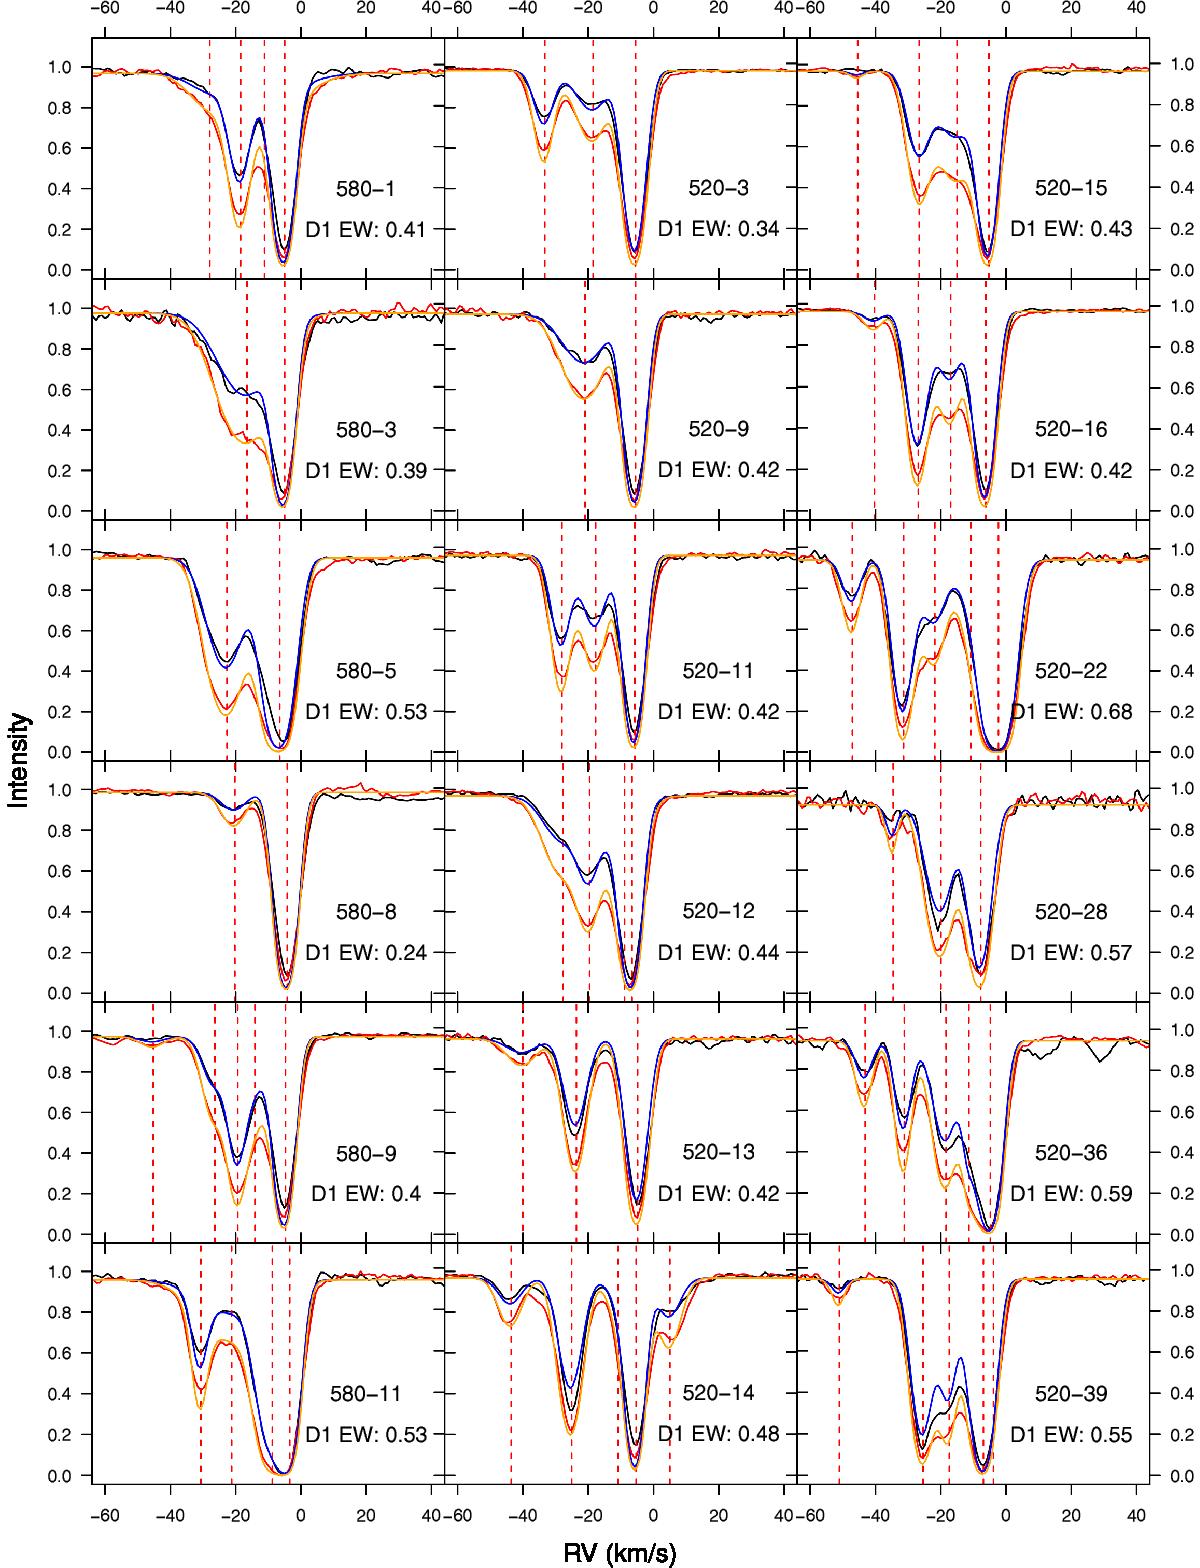
Profiles of interstellar sodium D1 (black) and D2 (red) lines from UVES spectra (both setups 580 and 520, as labeled). The stellar line contributions, when present, were removed by division with suitable template spectra. The orange curves are multiple-Gaussian best-fit models to the D2 profiles; the blue curves are D1 profile predictions based on the D2 models, and assuming pure absorption (see text). Vertical red dashed lines indicate the best-fit RVs of model components. Total equivalent widths for the D1 lines are also indicated (in Angstroms).
Current usage metrics show cumulative count of Article Views (full-text article views including HTML views, PDF and ePub downloads, according to the available data) and Abstracts Views on Vision4Press platform.
Data correspond to usage on the plateform after 2015. The current usage metrics is available 48-96 hours after online publication and is updated daily on week days.
Initial download of the metrics may take a while.