Fig. 3
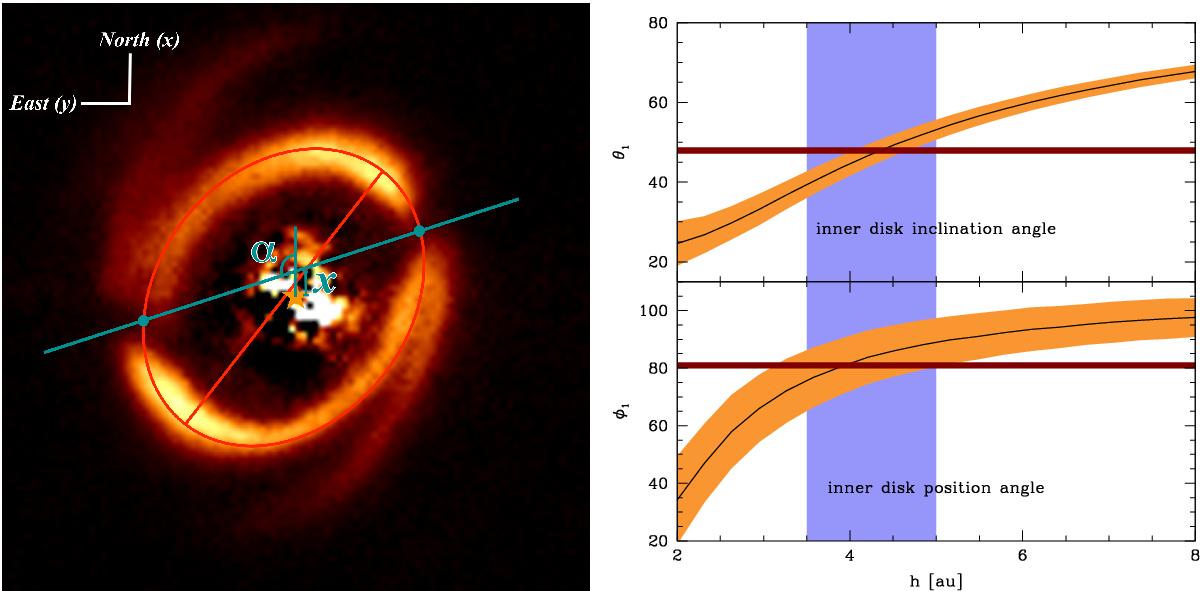
Left: SPHERE image of the disk surrounding HD 100453. The image presents the polarimetric intensity in the R-band. Indicated are also the ellipse of the outer disk (from Benisty et al. 2017) and the position angle of the line connecting the shadows. Right: the derived inclination and position angle for the inner disk surrounding HD 100453 as a function of the assumed height of the scattering surface on the outer disk, h. The purple coloured regions indicate where we expect the height of the outer disk to be using models of the spectral energy distribution. The orange regions indicate the values for θ1 and φ1 given the uncertainties as defined in the text. The red horizontal bars indicate the values for θ1 and φ1 (with error bars) as derived from interferometric observations (Lazareff et al. 2017).
Current usage metrics show cumulative count of Article Views (full-text article views including HTML views, PDF and ePub downloads, according to the available data) and Abstracts Views on Vision4Press platform.
Data correspond to usage on the plateform after 2015. The current usage metrics is available 48-96 hours after online publication and is updated daily on week days.
Initial download of the metrics may take a while.