Fig. 1
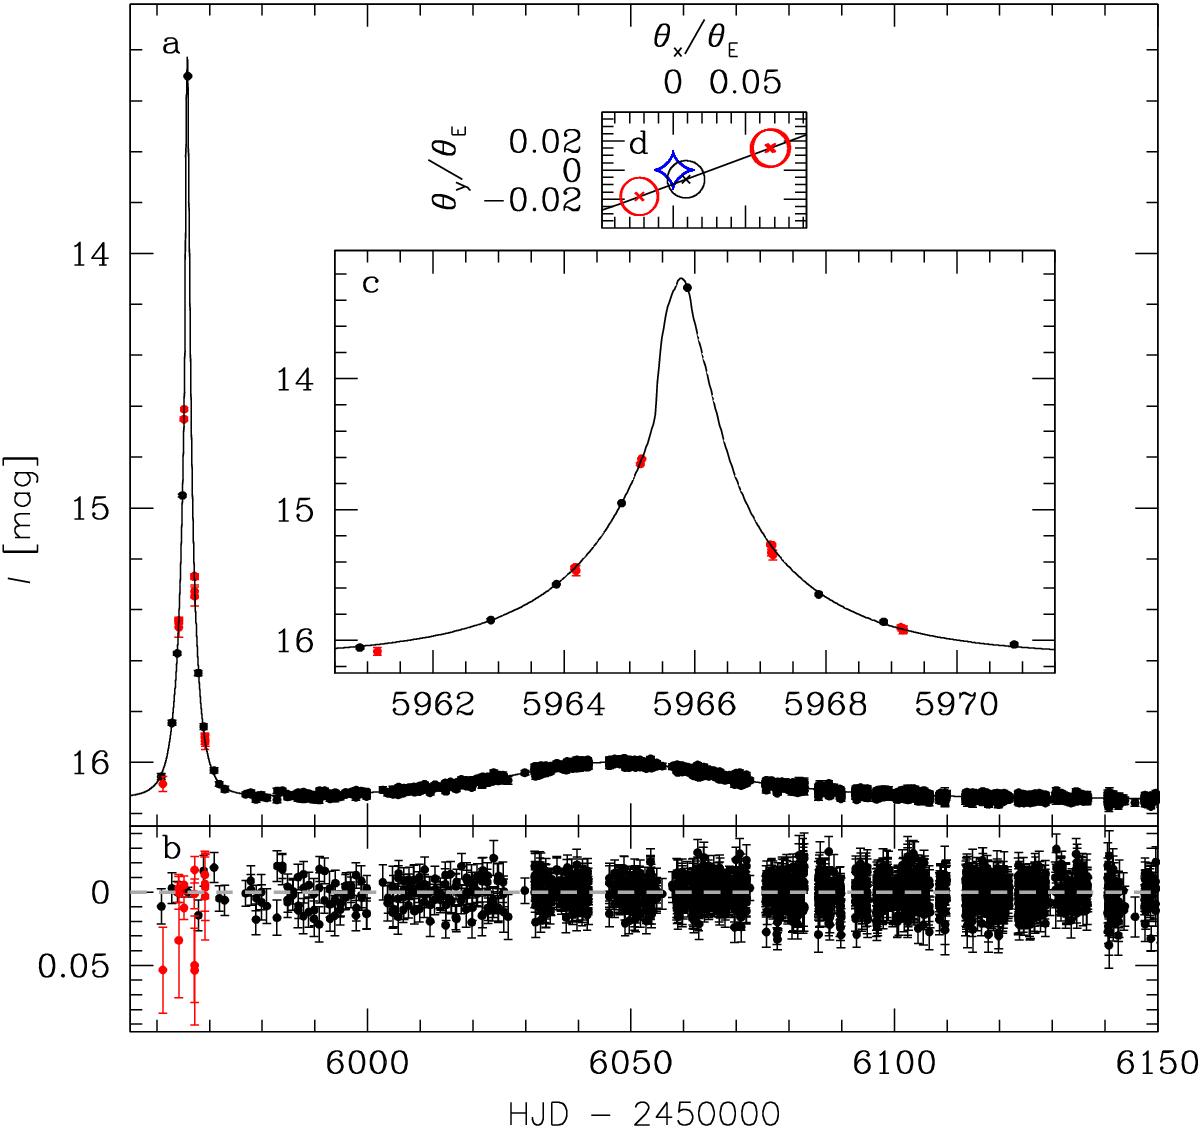
Light curve of MOA-2012-BLG-006 = OGLE-2012-BLG-0022. OGLE and MOA data are marked using black and red points, respectively. Panel a) presents the 2012 light curve with both subevents. Panel b) shows the model residuals. Panel c) gives zoom-in on the anomaly. Panel d) presents the source trajectory (black line) relative to the planetary caustic (blue curve), which is at the origin of the coordinate system. The host star is located at (θx/θE,θy/θE) = (4.17,0.0). Source positions from one OGLE night and two MOA nights are marked and are aligned with photometry shown in panel c). The circles have a radius of ρ.
Current usage metrics show cumulative count of Article Views (full-text article views including HTML views, PDF and ePub downloads, according to the available data) and Abstracts Views on Vision4Press platform.
Data correspond to usage on the plateform after 2015. The current usage metrics is available 48-96 hours after online publication and is updated daily on week days.
Initial download of the metrics may take a while.