Fig. 7
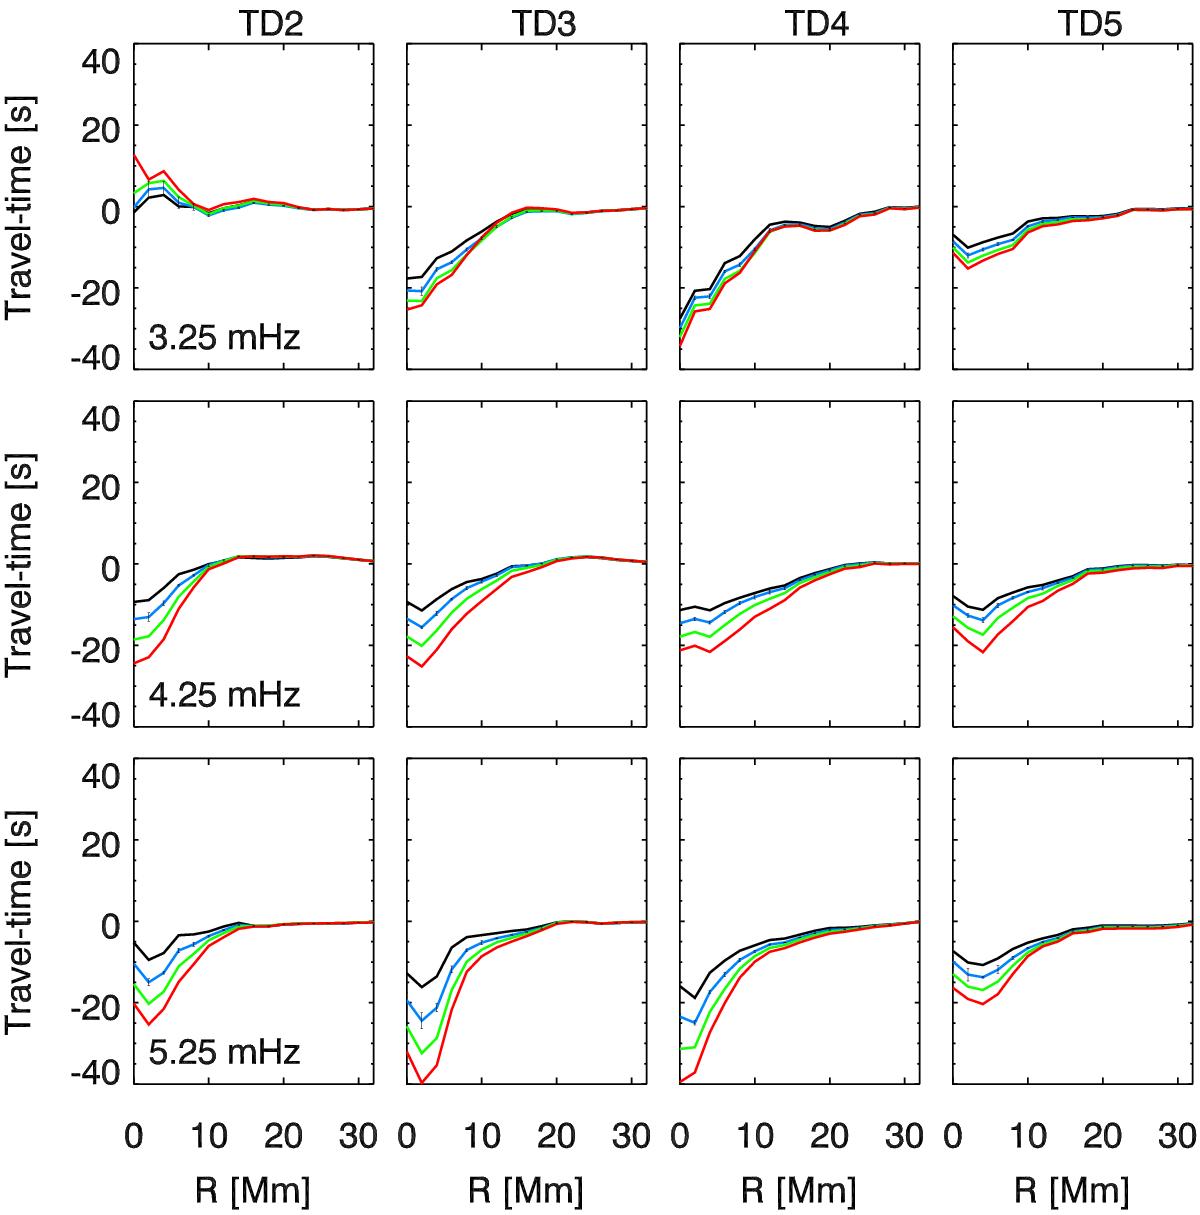
Radial variation of the azimuthally averaged travel-time shifts measured for the simulations with Bu = 1500 G and zWD = 250 km (black), zWD = 350 km (blue), zWD = 450 km (green), or zWD = 550 km (red). The columns correspond to different phase-speed filters, from lower phase speed (left panels) to higher phase speed (right panels). The rows correspond to frequency filters centered at 3.25 mHz (top panels), 4.25 mHz (middle panels), and 5.25 mHz (bottom panels). The errors bars shown represent an assessment of measurement errors of the travel-time shift differences between two models (see text).
Current usage metrics show cumulative count of Article Views (full-text article views including HTML views, PDF and ePub downloads, according to the available data) and Abstracts Views on Vision4Press platform.
Data correspond to usage on the plateform after 2015. The current usage metrics is available 48-96 hours after online publication and is updated daily on week days.
Initial download of the metrics may take a while.