Fig. 3
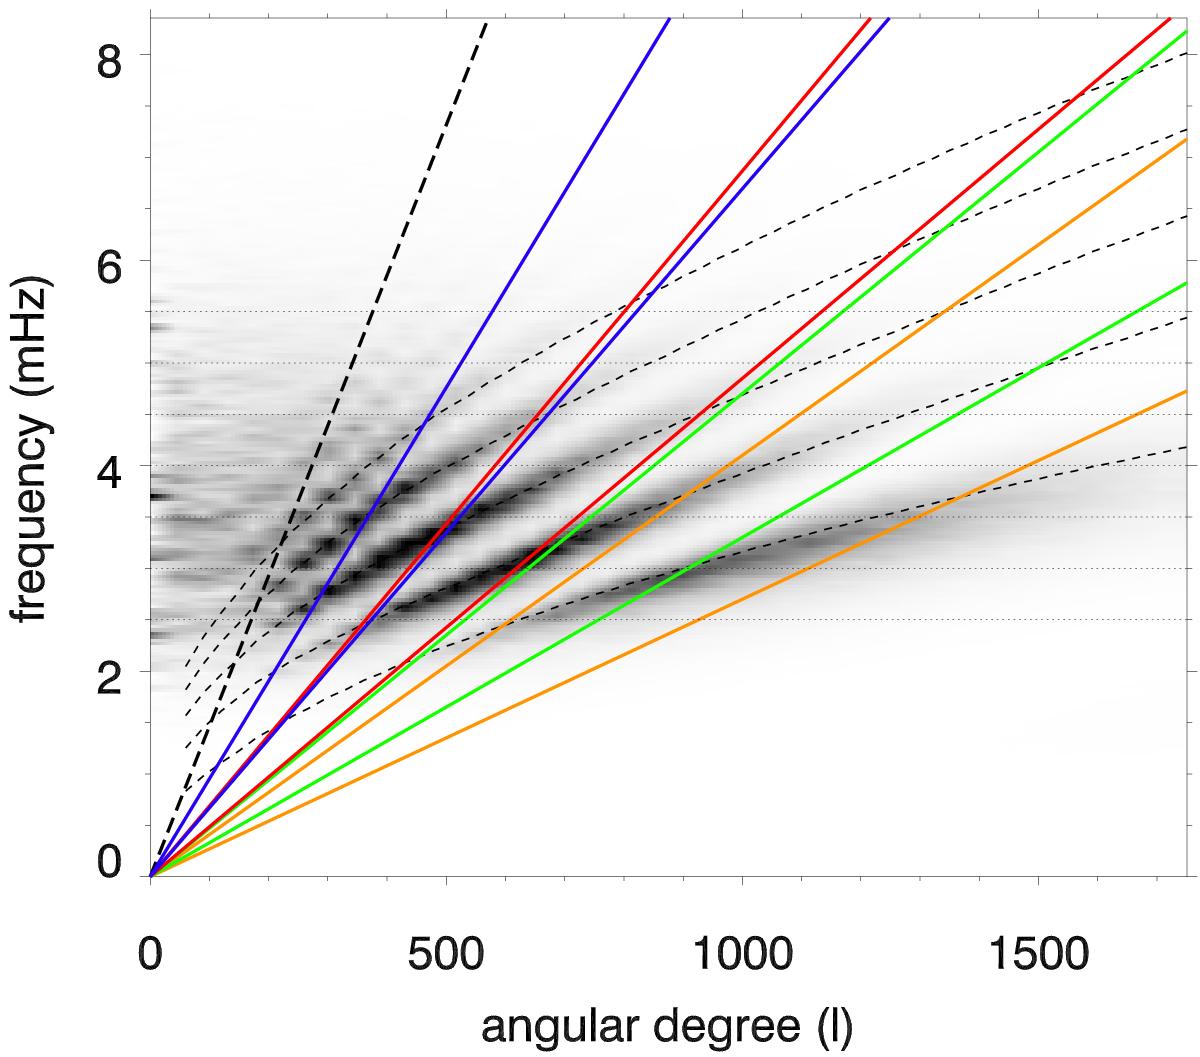
Power spectrum of the vertical velocity at log τ = 0.01 from the quiet Sun simulation. The gray-scale represents the power from low (white) to high (black). The thin dashed lines indicate the position of the eigenfrequencies of the f and p modes in model S. The thick dashed line illustrates the region where the phase speed is equal to the sound speed at the bottom boundary of the model. Regions between lines with the same color correspond to the range in phase speed spanned by phase-speed filters TD2 (orange), TD3 (green), TD4 (red), and TD5 (dark blue). The horizontal dotted lines at constant frequency mark the bandpass regions of the frequency filters.
Current usage metrics show cumulative count of Article Views (full-text article views including HTML views, PDF and ePub downloads, according to the available data) and Abstracts Views on Vision4Press platform.
Data correspond to usage on the plateform after 2015. The current usage metrics is available 48-96 hours after online publication and is updated daily on week days.
Initial download of the metrics may take a while.