Fig. 2
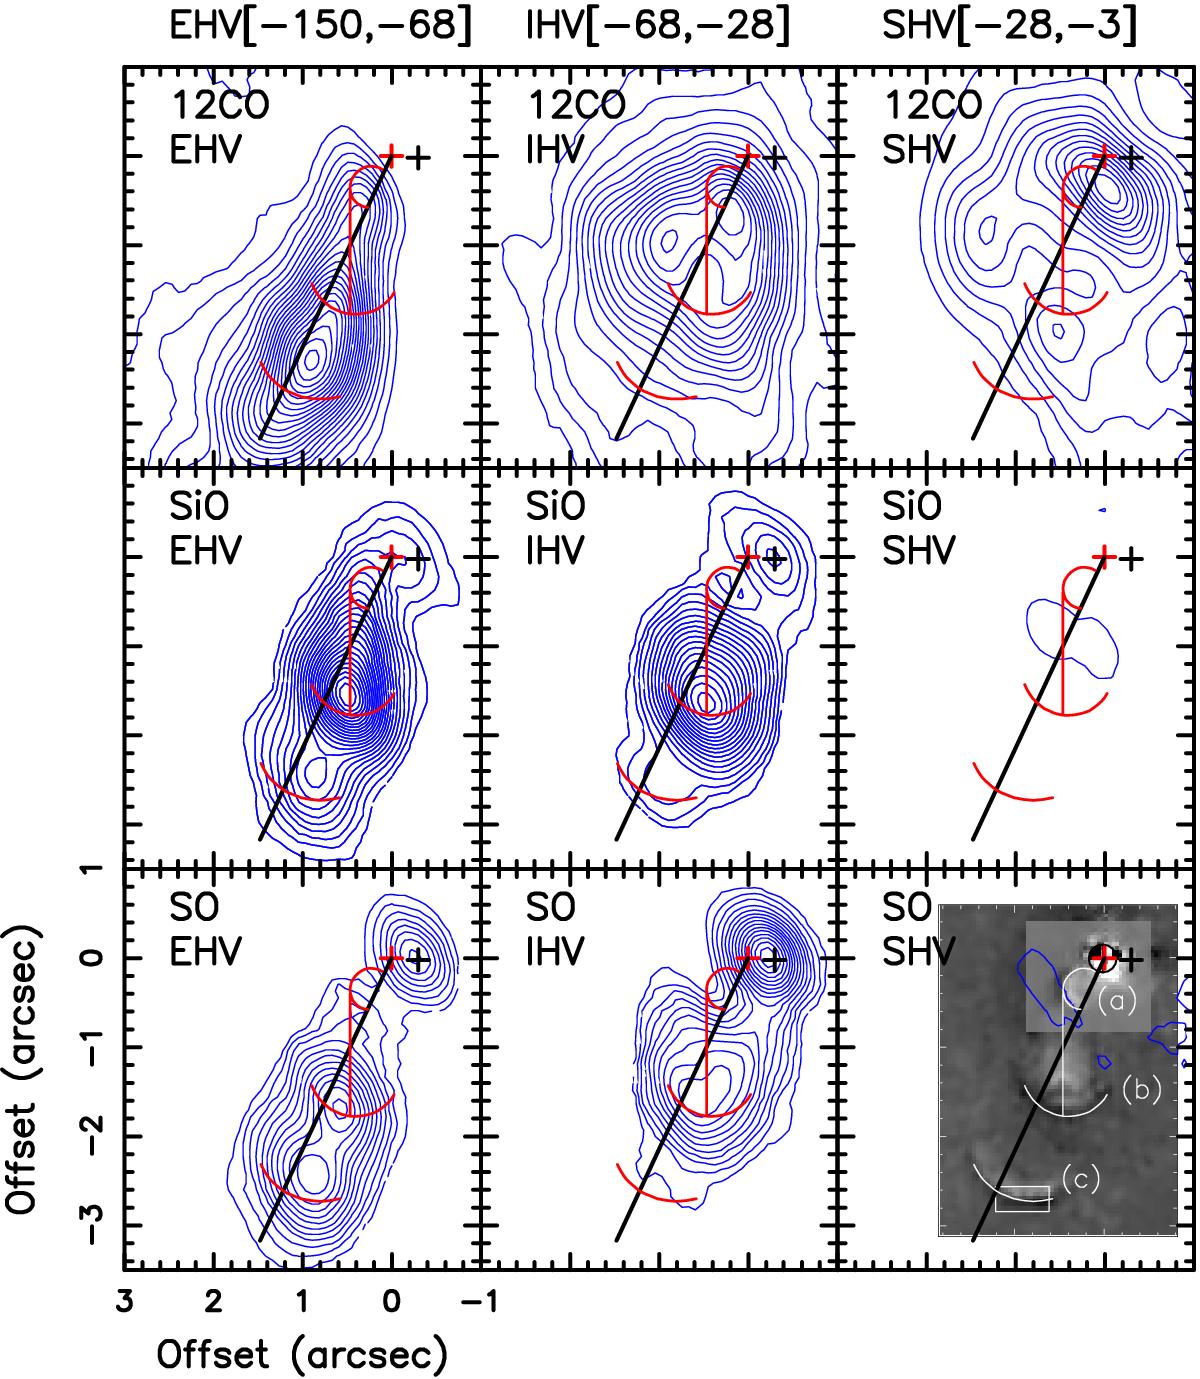
Maps of CO, SiO and SO integrated over three VLSR ranges: EHV = –150 to –68 km s-1, IHV = –68 to –28 km s-1, SHV = –28 to − 3 km s-1. Red and black crosses denote VLA4B and VLA4A, respectively. The compact emission peaked on VLA4A is entirely due to COMs (identified in Figs. D.2 and D.3). The bottom right panel shows Fig. 4 of HC14 registered on VLA4B. Their main H2 features are outlined in white (cf. text and expanded view in Fig. C.1). They are reported in red in the other panels. The black line displays PA = 155° (B00).
Current usage metrics show cumulative count of Article Views (full-text article views including HTML views, PDF and ePub downloads, according to the available data) and Abstracts Views on Vision4Press platform.
Data correspond to usage on the plateform after 2015. The current usage metrics is available 48-96 hours after online publication and is updated daily on week days.
Initial download of the metrics may take a while.