Fig. 9
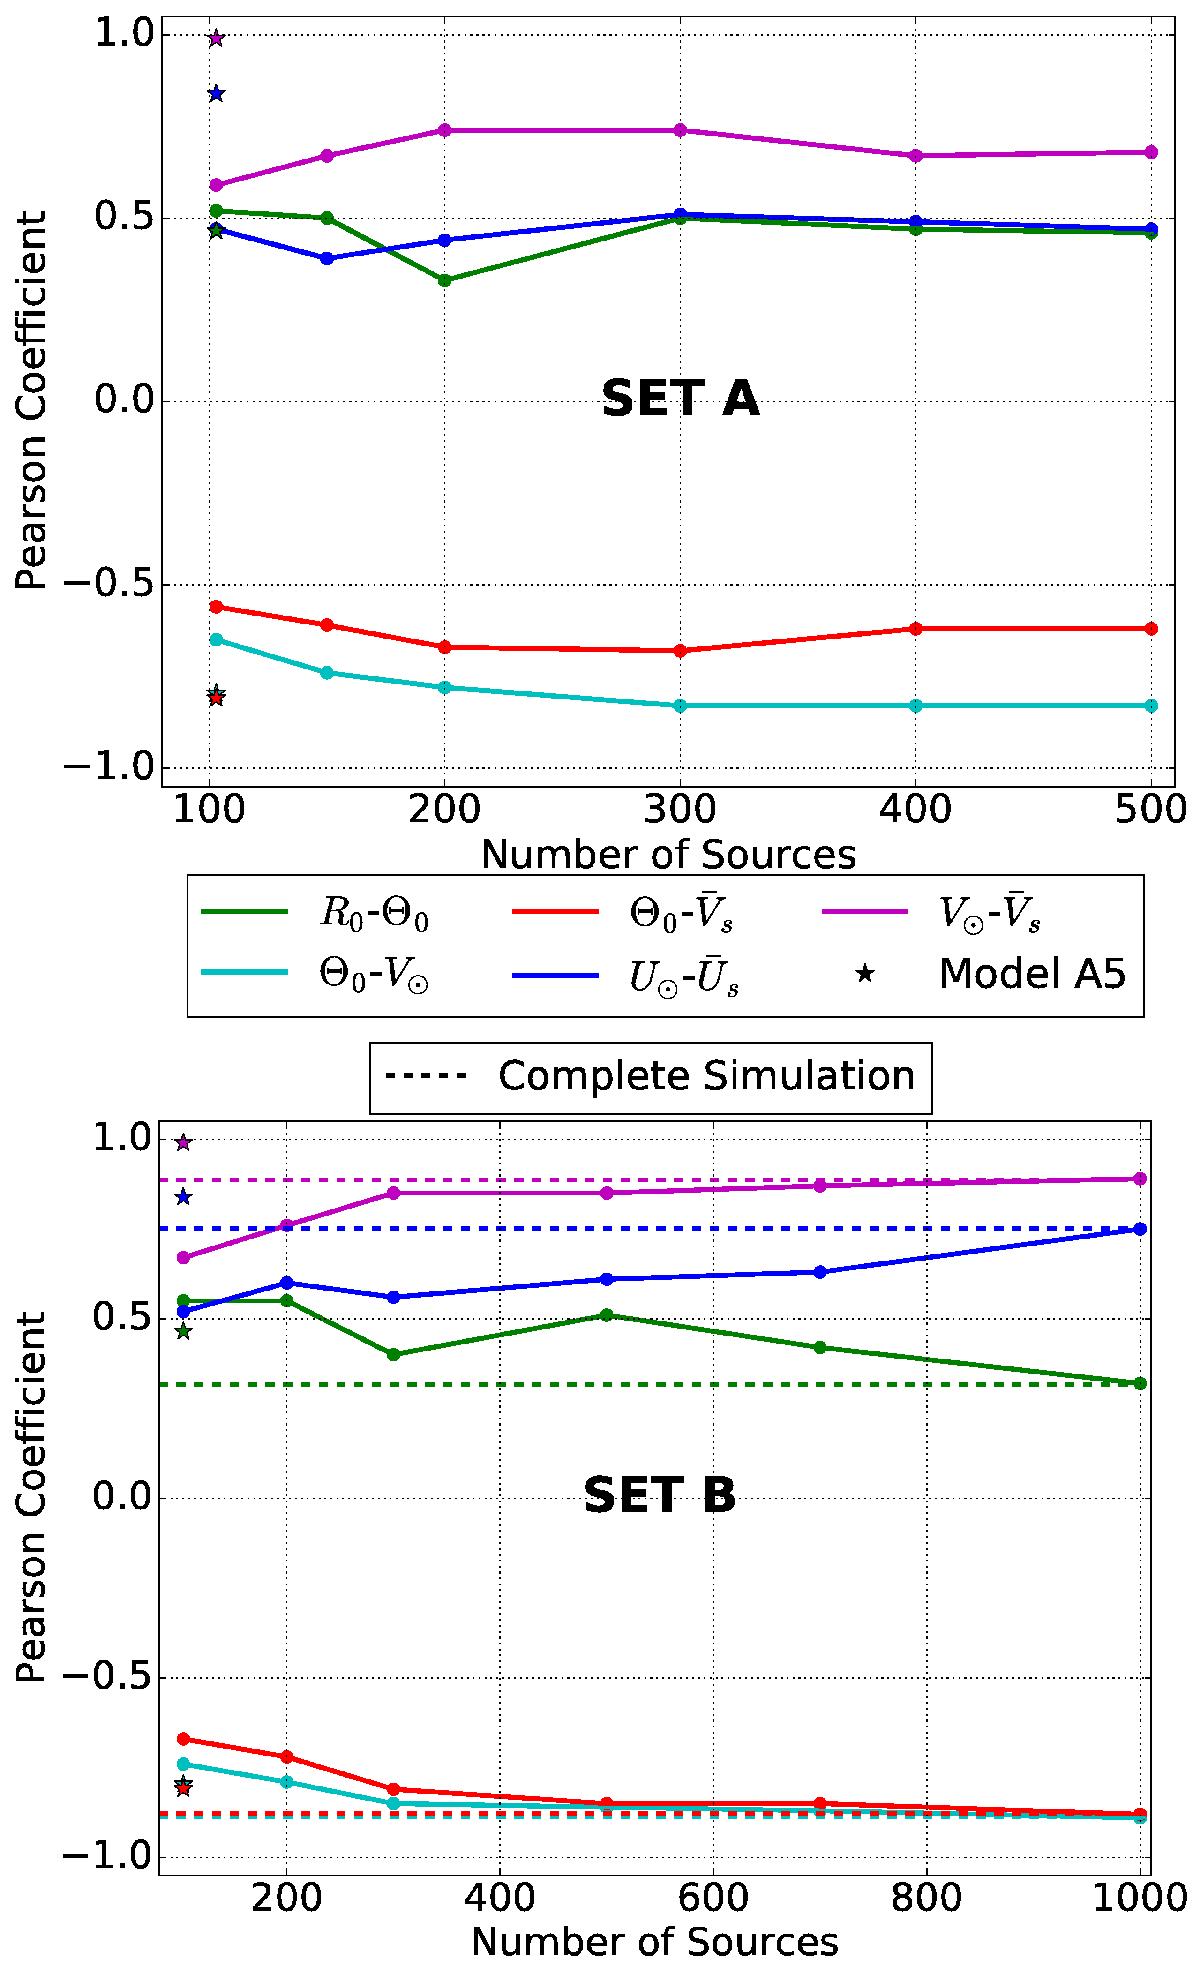
Pearson product-moment correlation coefficients calculated for initially highly correlated values (see Table 5), when more sources are added in sets A (top panel) and B (bottom panel). Pearson coefficients reported by Reid et al. (2014) are shown as stars and those for the complete sample (N = 1300) are represented by dashed lines.
Current usage metrics show cumulative count of Article Views (full-text article views including HTML views, PDF and ePub downloads, according to the available data) and Abstracts Views on Vision4Press platform.
Data correspond to usage on the plateform after 2015. The current usage metrics is available 48-96 hours after online publication and is updated daily on week days.
Initial download of the metrics may take a while.