Free Access
Fig. 6
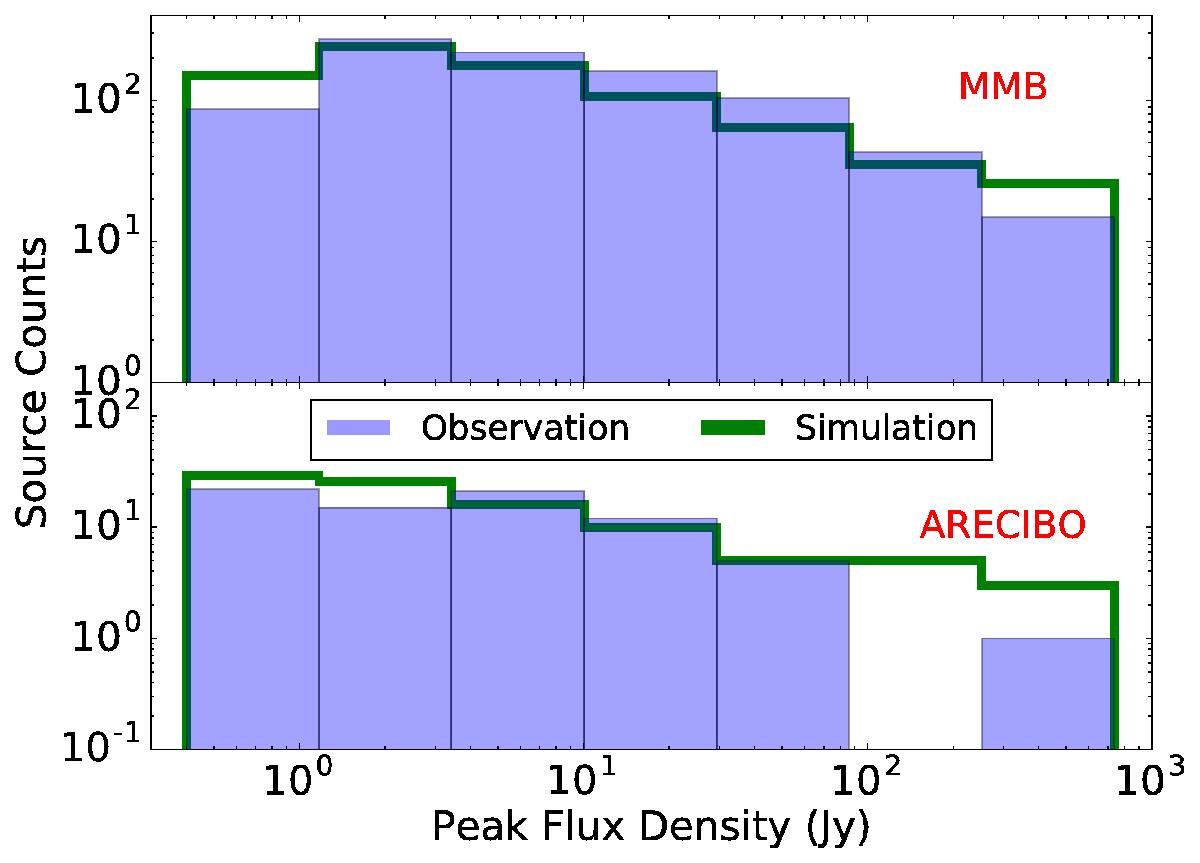
In blue: flux density function obtained for the MMB (top) and the Arecibo survey (bottom). In green: simulated flux density function obtained in the model (using N = 1300 and α = −1.43) after the MMB and Arecibo limits were applied (Table 3).
Current usage metrics show cumulative count of Article Views (full-text article views including HTML views, PDF and ePub downloads, according to the available data) and Abstracts Views on Vision4Press platform.
Data correspond to usage on the plateform after 2015. The current usage metrics is available 48-96 hours after online publication and is updated daily on week days.
Initial download of the metrics may take a while.