Fig. 2
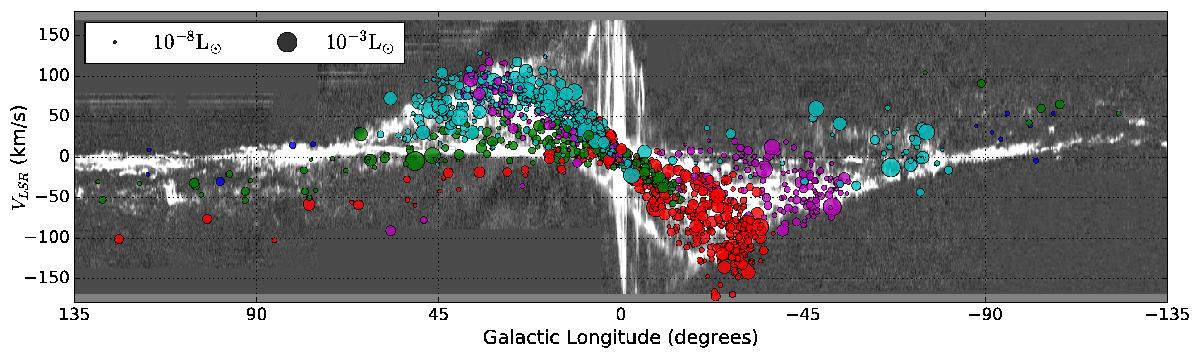
Velocity with respect to the LSR as a function of the Galactic longitude for the simulated 6.7 GHz methanol masers distribution. The point size is a measure of the peak luminosity function (Sect. 2.5). Masers associated with different spiral arms are color-coded as in Fig. 1. The figure is overlaid on the CO emission (J = 1−0) plotted in grayscale and taken from Dame et al. (2001).
Current usage metrics show cumulative count of Article Views (full-text article views including HTML views, PDF and ePub downloads, according to the available data) and Abstracts Views on Vision4Press platform.
Data correspond to usage on the plateform after 2015. The current usage metrics is available 48-96 hours after online publication and is updated daily on week days.
Initial download of the metrics may take a while.