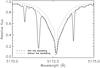
Fig. 2
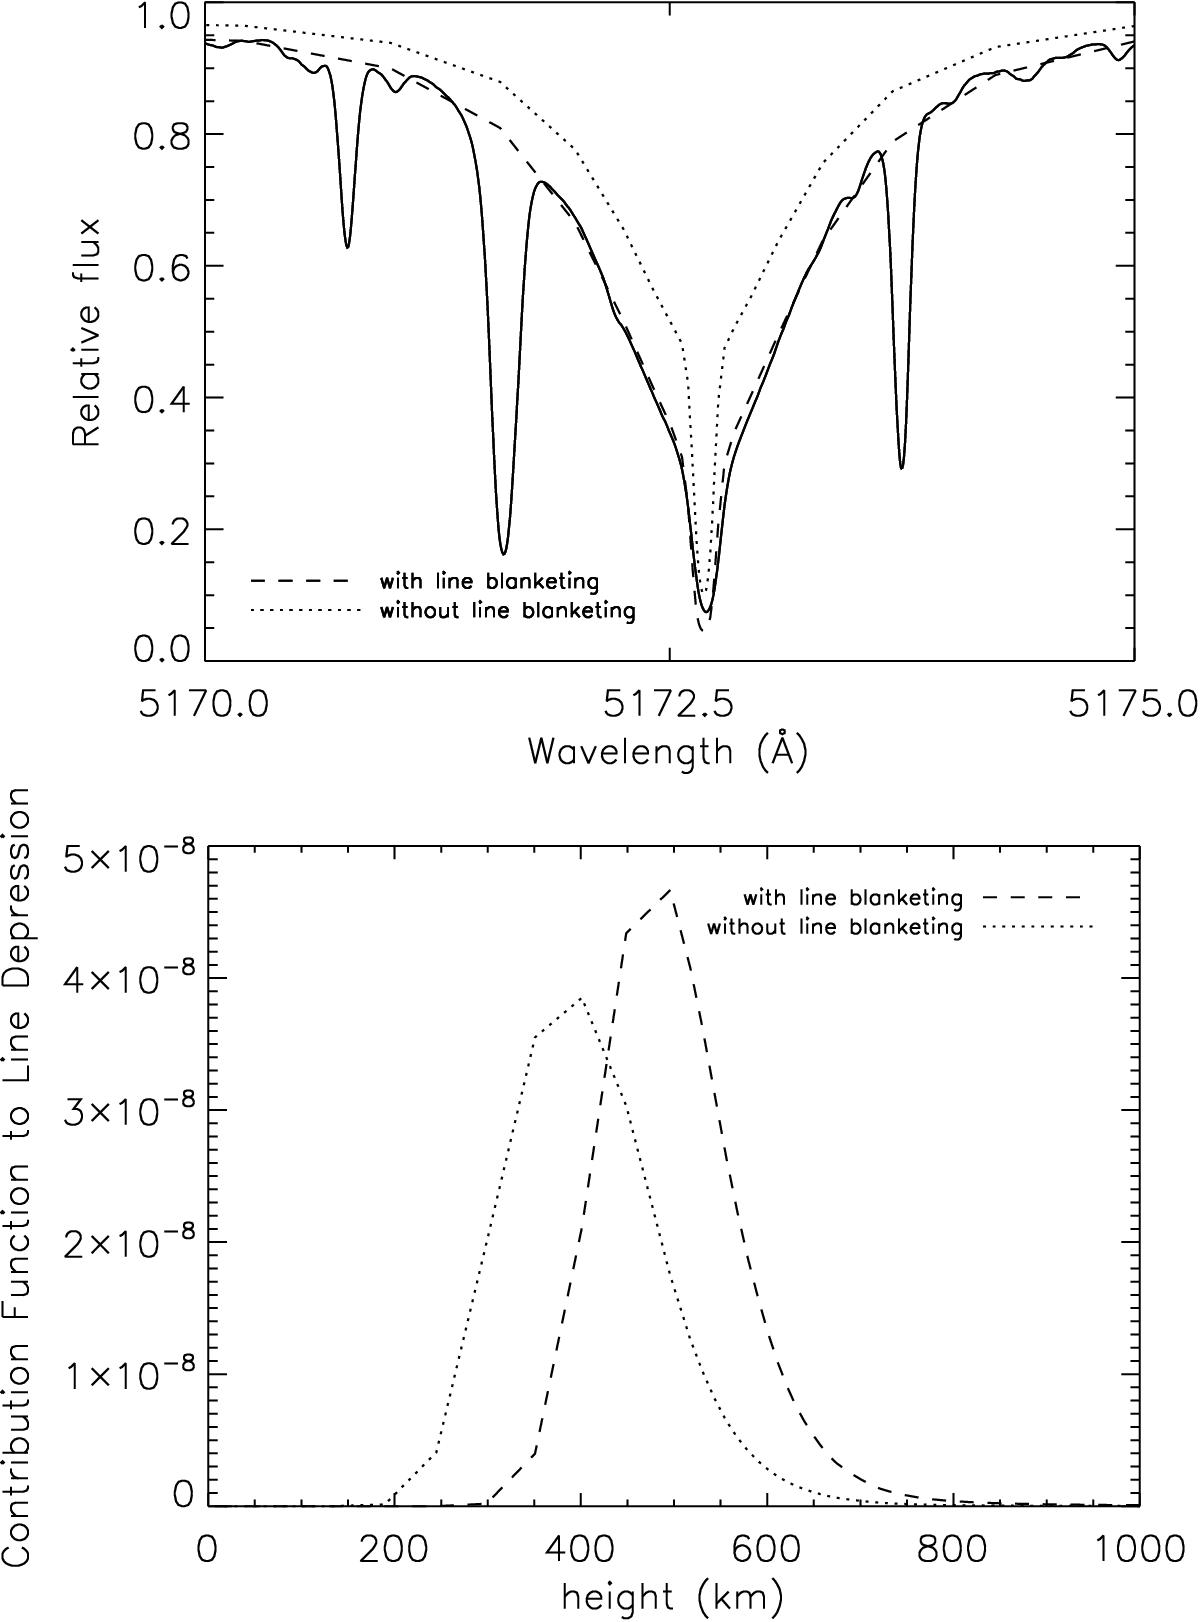
Upper panel: synthetic profiles of the Mg i b2 line obtained with the ALC model of the solar atmosphere with (dashed line) and without (dotted line) line blanketing. The solid line is the observed profile. Lower panel: contribution function to line-depression (erg cm3 s-1 Å-1) for the 4571 Å line versus height, for the same atmospheric model as in the upper panel, with (dashed line) and without (dotted line) line blanketing.
Current usage metrics show cumulative count of Article Views (full-text article views including HTML views, PDF and ePub downloads, according to the available data) and Abstracts Views on Vision4Press platform.
Data correspond to usage on the plateform after 2015. The current usage metrics is available 48-96 hours after online publication and is updated daily on week days.
Initial download of the metrics may take a while.