Fig. 1
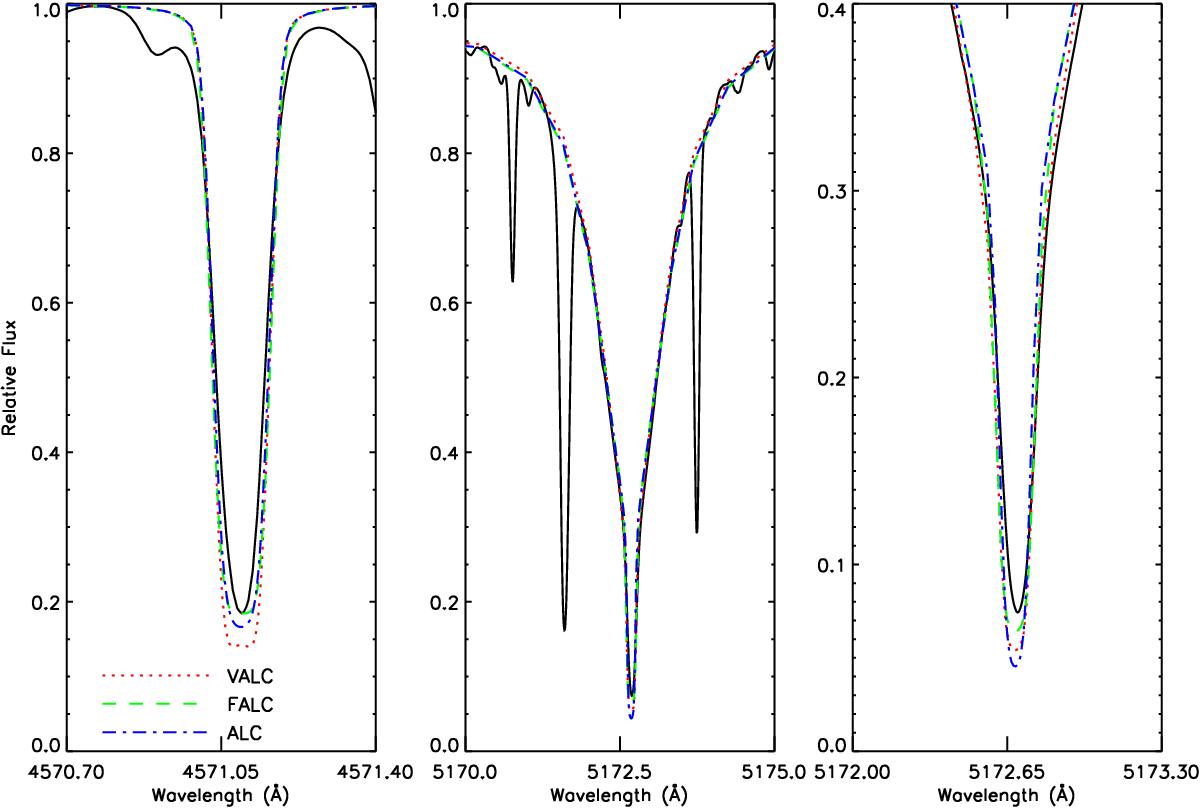
Mg i 4571 Å (left panel) and 5173 Å (b2, middle and right panel) observed and synthetic line profiles for the Sun. The third panel magnifies the b2 core. The black solid lines are the observed profiles (Kitt Peak solar flux atlas, Kurucz et al. 1984) while the red dotted, green dashed, and blue dash-dotted lines are the synthetic profiles obtained by using three different atmospheric models, VALC, FALC, and ALC, respectively.
Current usage metrics show cumulative count of Article Views (full-text article views including HTML views, PDF and ePub downloads, according to the available data) and Abstracts Views on Vision4Press platform.
Data correspond to usage on the plateform after 2015. The current usage metrics is available 48-96 hours after online publication and is updated daily on week days.
Initial download of the metrics may take a while.