Fig. 7
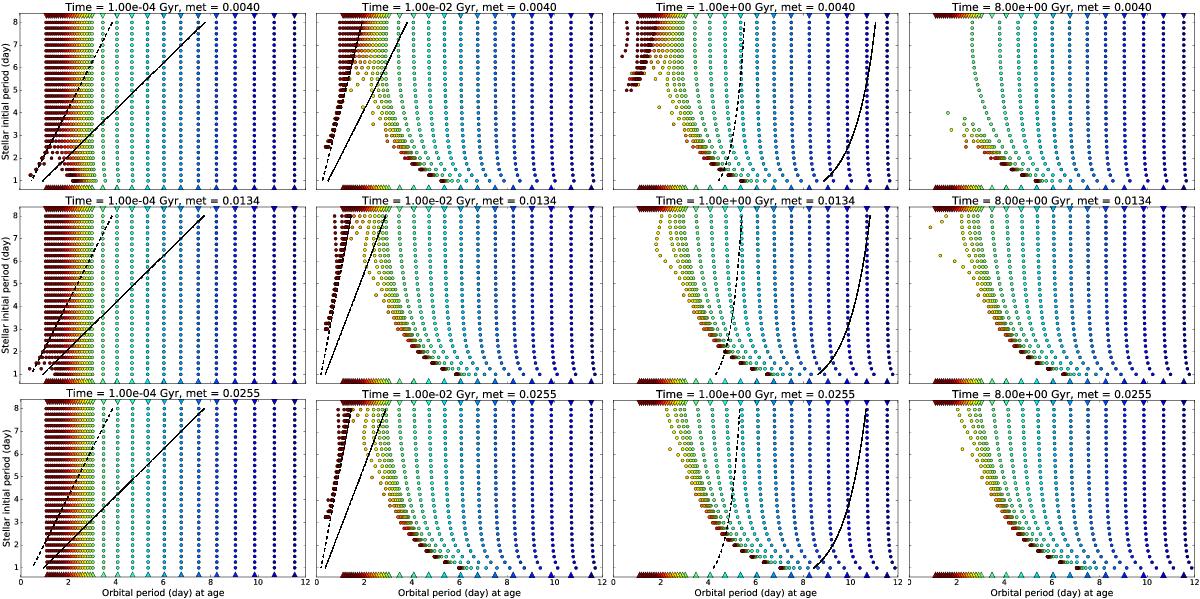
Evolution of a population of hot Jupiters at different initial orbital periods around different initial rotation periods of the star. The different panels are for different times (time = age – tinit, increasing from left to right) in the evolution of the system and different metallicities of the star (Z = 0.004, Z = 0.0134, and Z = 0.0255from top to bottom). The position of each colored circle represents the orbital period of one planet (x-axis) at the time considered and the initial rotation period of the star it orbits (y-axis). The planets orbiting initially fast-rotating stars are in the lower part of the diagram, while the planets orbiting initially slow-rotating stars are in the upper part. The color of the circle is an indication of the initial orbital period of the planet; the color-initial orbital period relationship is given by the colored triangles at the top and bottom of each panel. The dark red planets are initially close-in planets. The solid black line represents the corotation radius (delimiting inside and outside tidal migration) and the dashed black line represents the limit between the equilibrium and dynamical tide regimes corresponding to the simulation of the planet at 0.1 au.
Current usage metrics show cumulative count of Article Views (full-text article views including HTML views, PDF and ePub downloads, according to the available data) and Abstracts Views on Vision4Press platform.
Data correspond to usage on the plateform after 2015. The current usage metrics is available 48-96 hours after online publication and is updated daily on week days.
Initial download of the metrics may take a while.