Fig. 8
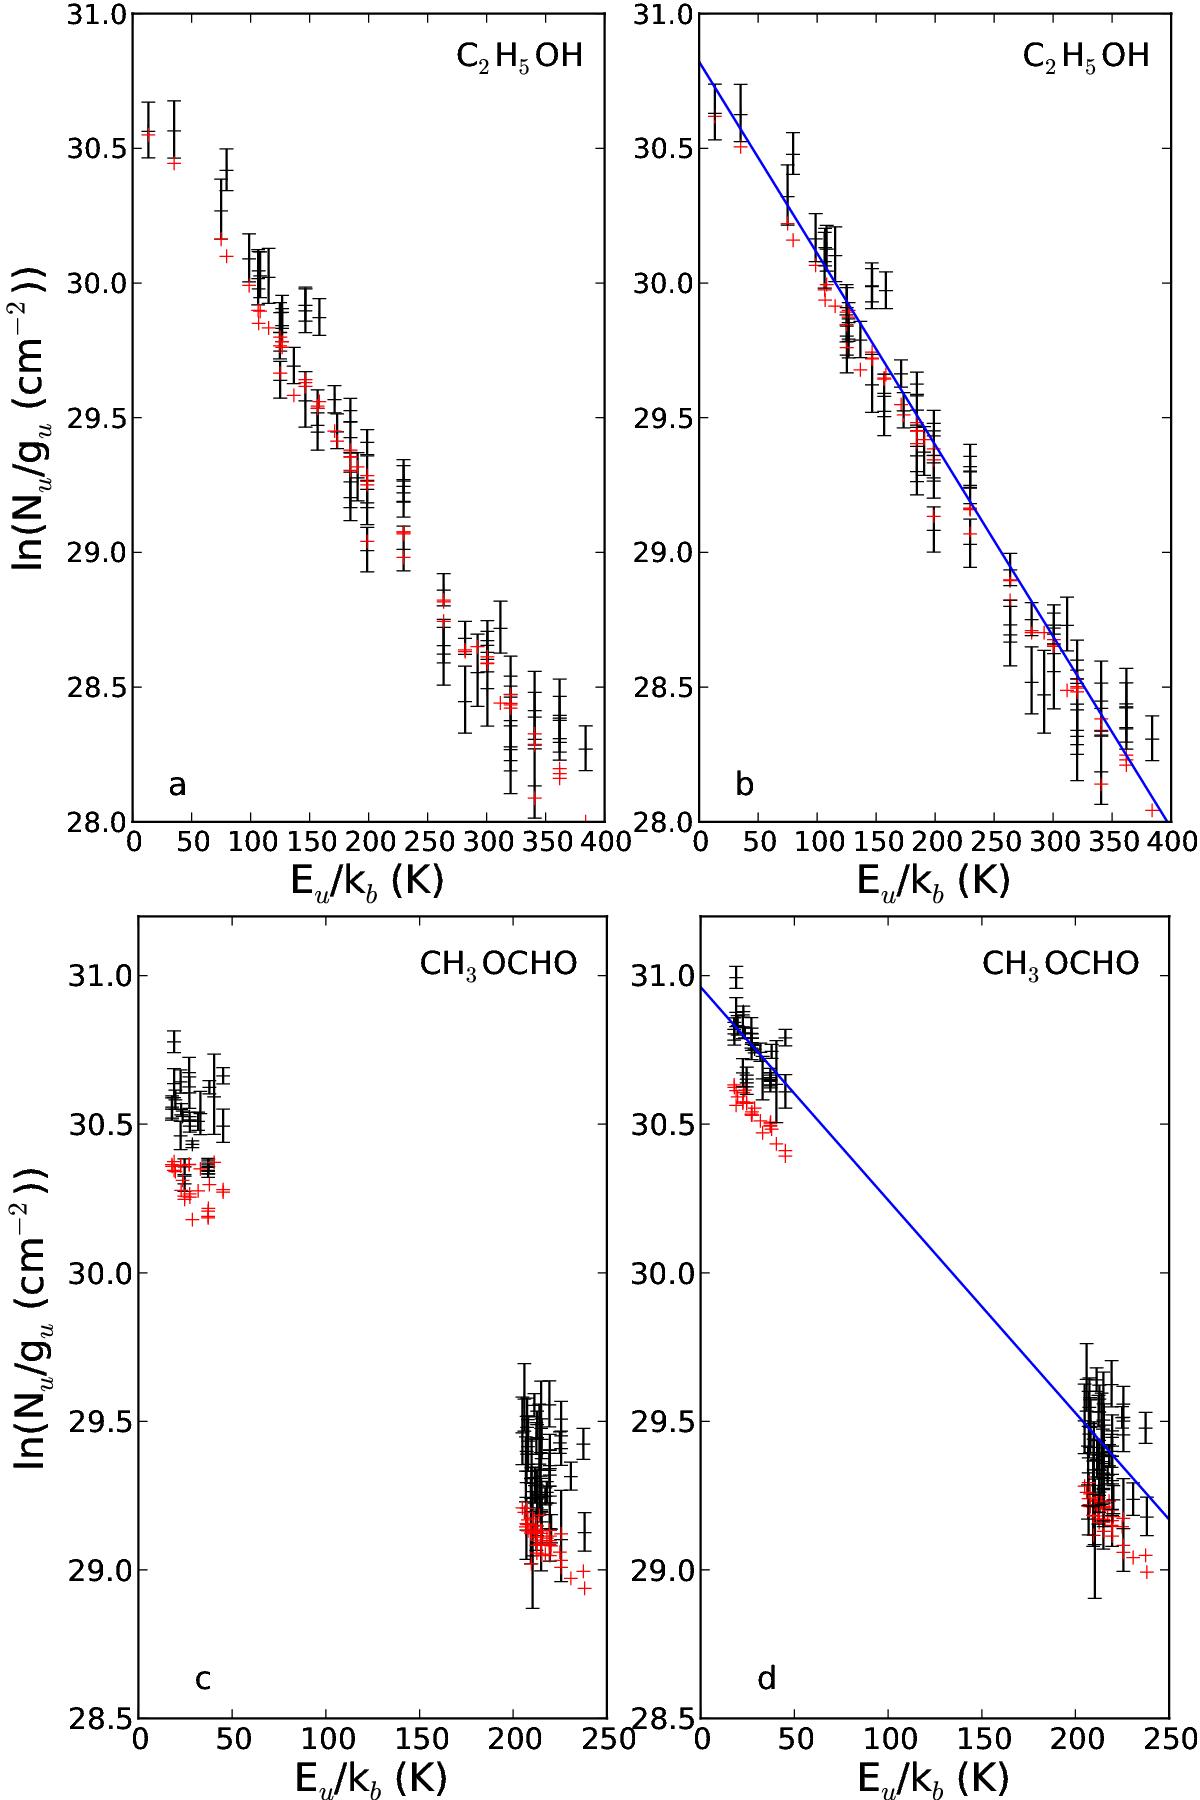
Population diagrams of C2H5OH (panels a and b) and CH3OCHO (panels c and d) for Sgr B2(N3). The black points are computed using the integrated intensities of the observed spectrum while the red points are computed using the integrated intensities of our synthetic model. The error bars on the observed data points are 1σ uncertainties on Nu/gu. No correction is applied in panels a and c, while in panels b and d the optical depth correction has been applied to both the observed and synthetic populations and the contamination from all other species included in the full LTE model has been removed from the observed data points. The blue line is the weighted linear fit to the observed populations.
Current usage metrics show cumulative count of Article Views (full-text article views including HTML views, PDF and ePub downloads, according to the available data) and Abstracts Views on Vision4Press platform.
Data correspond to usage on the plateform after 2015. The current usage metrics is available 48-96 hours after online publication and is updated daily on week days.
Initial download of the metrics may take a while.