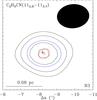
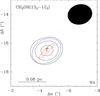
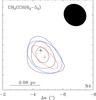
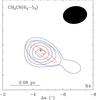
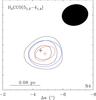
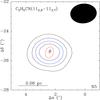
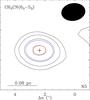
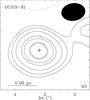
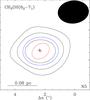
Fig. 7
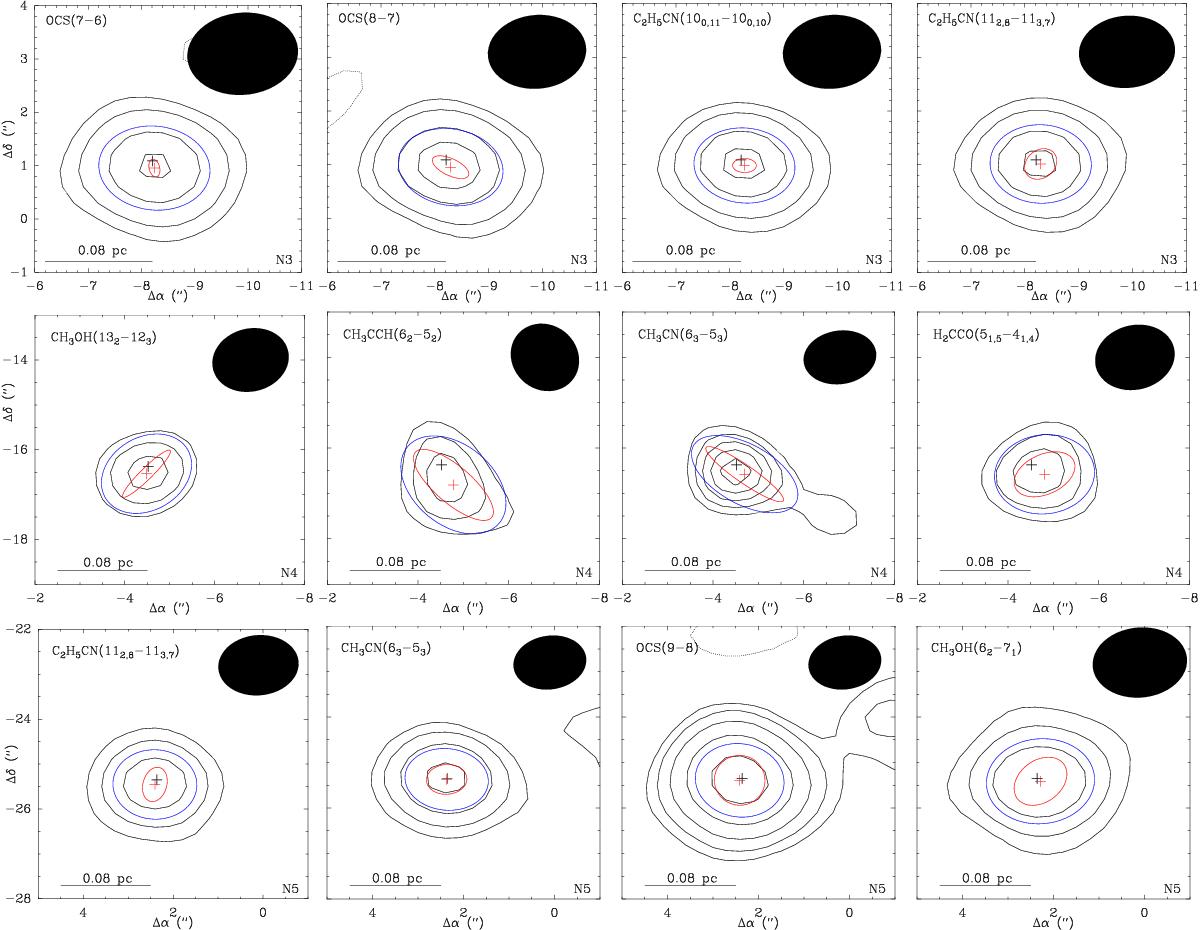
Integrated intensity maps of selected transitions toward Sgr B2(N3) (top row), Sgr B2(N4) (middle row), and Sgr B2(N5) (bottom row). For each map, the red cross shows the peak position of the emission and the black cross is the reference position of the hot core derived from Fig. 1. The blue ellipse represents the result of the Gaussian fit to the map while the red ellipse is the deconvolved emission size. The black filled ellipse represents the synthesized beam. The rms and contour levels are indicated in Table 6.
Current usage metrics show cumulative count of Article Views (full-text article views including HTML views, PDF and ePub downloads, according to the available data) and Abstracts Views on Vision4Press platform.
Data correspond to usage on the plateform after 2015. The current usage metrics is available 48-96 hours after online publication and is updated daily on week days.
Initial download of the metrics may take a while.