Fig. 6
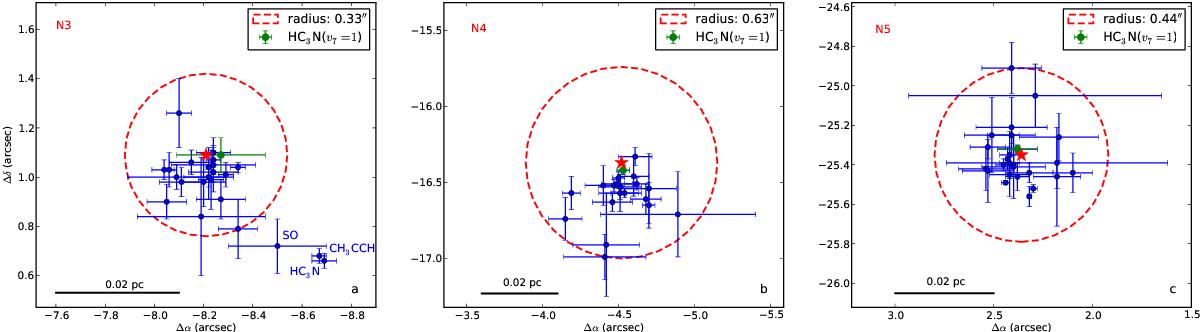
Spatial distribution of the molecules identified around Sgr B2(N3), Sgr B2(N4), and Sgr B2(N5). In each panel, the red star represents the position of the hot core derived from Fig. 1. Blue crosses represent the mean peak position for each species. Error bars correspond to the standard deviation weighted by the uncertainties given by the GAUSS-2D routine. The radius of the dashed circle is given in the top right corner. The average peak position of HC3N, ν7 = 1 is shown in green.
Current usage metrics show cumulative count of Article Views (full-text article views including HTML views, PDF and ePub downloads, according to the available data) and Abstracts Views on Vision4Press platform.
Data correspond to usage on the plateform after 2015. The current usage metrics is available 48-96 hours after online publication and is updated daily on week days.
Initial download of the metrics may take a while.