Fig. 4
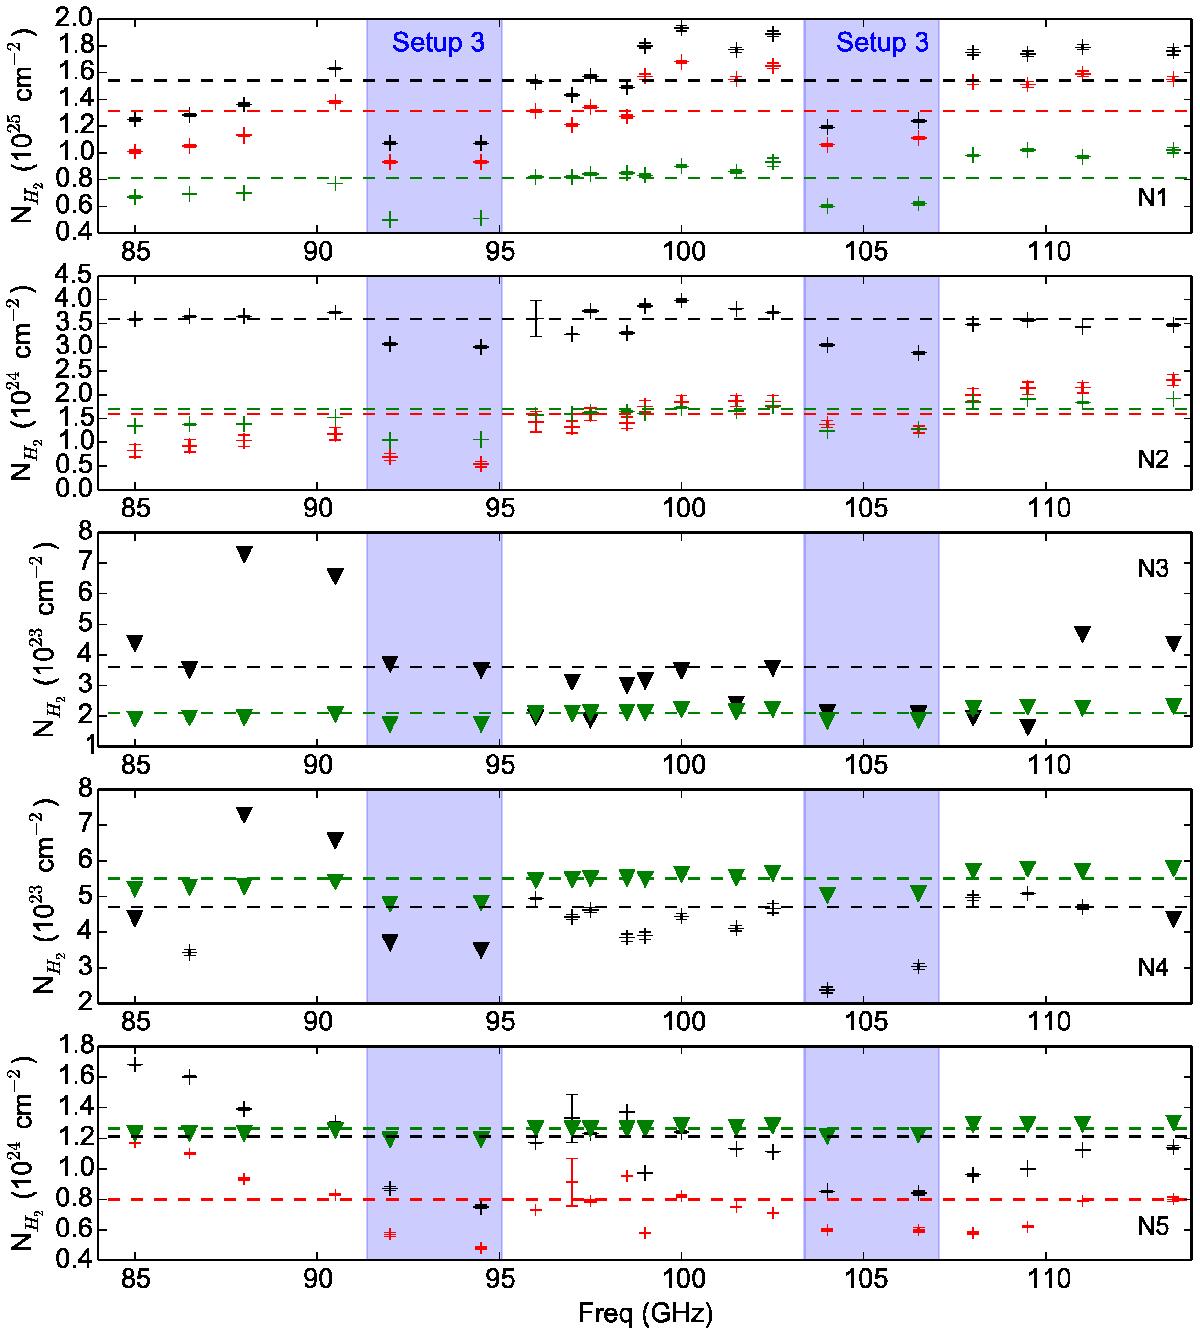
H2 column densities as a function of frequency for the five hot cores embedded in Sgr B2(N). The values obtained based on the ALMA data before and after correction for the free-free contribution are shown as black and red crosses respectively. The green crosses represent the results obtained based on the SMA map at 343 GHz smoothed to the angular resolution of the ALMA maps. Error bars are calculated from the error on ![]() given by the GAUSS-2D routine and take into account the uncertainty on the correction for the free-free emission. The triangles represent 5σ upper limits. The dashed line in each panel is the average H2 column density (or upper limit) excluding setup 3.
given by the GAUSS-2D routine and take into account the uncertainty on the correction for the free-free emission. The triangles represent 5σ upper limits. The dashed line in each panel is the average H2 column density (or upper limit) excluding setup 3.
Current usage metrics show cumulative count of Article Views (full-text article views including HTML views, PDF and ePub downloads, according to the available data) and Abstracts Views on Vision4Press platform.
Data correspond to usage on the plateform after 2015. The current usage metrics is available 48-96 hours after online publication and is updated daily on week days.
Initial download of the metrics may take a while.