Fig. 3
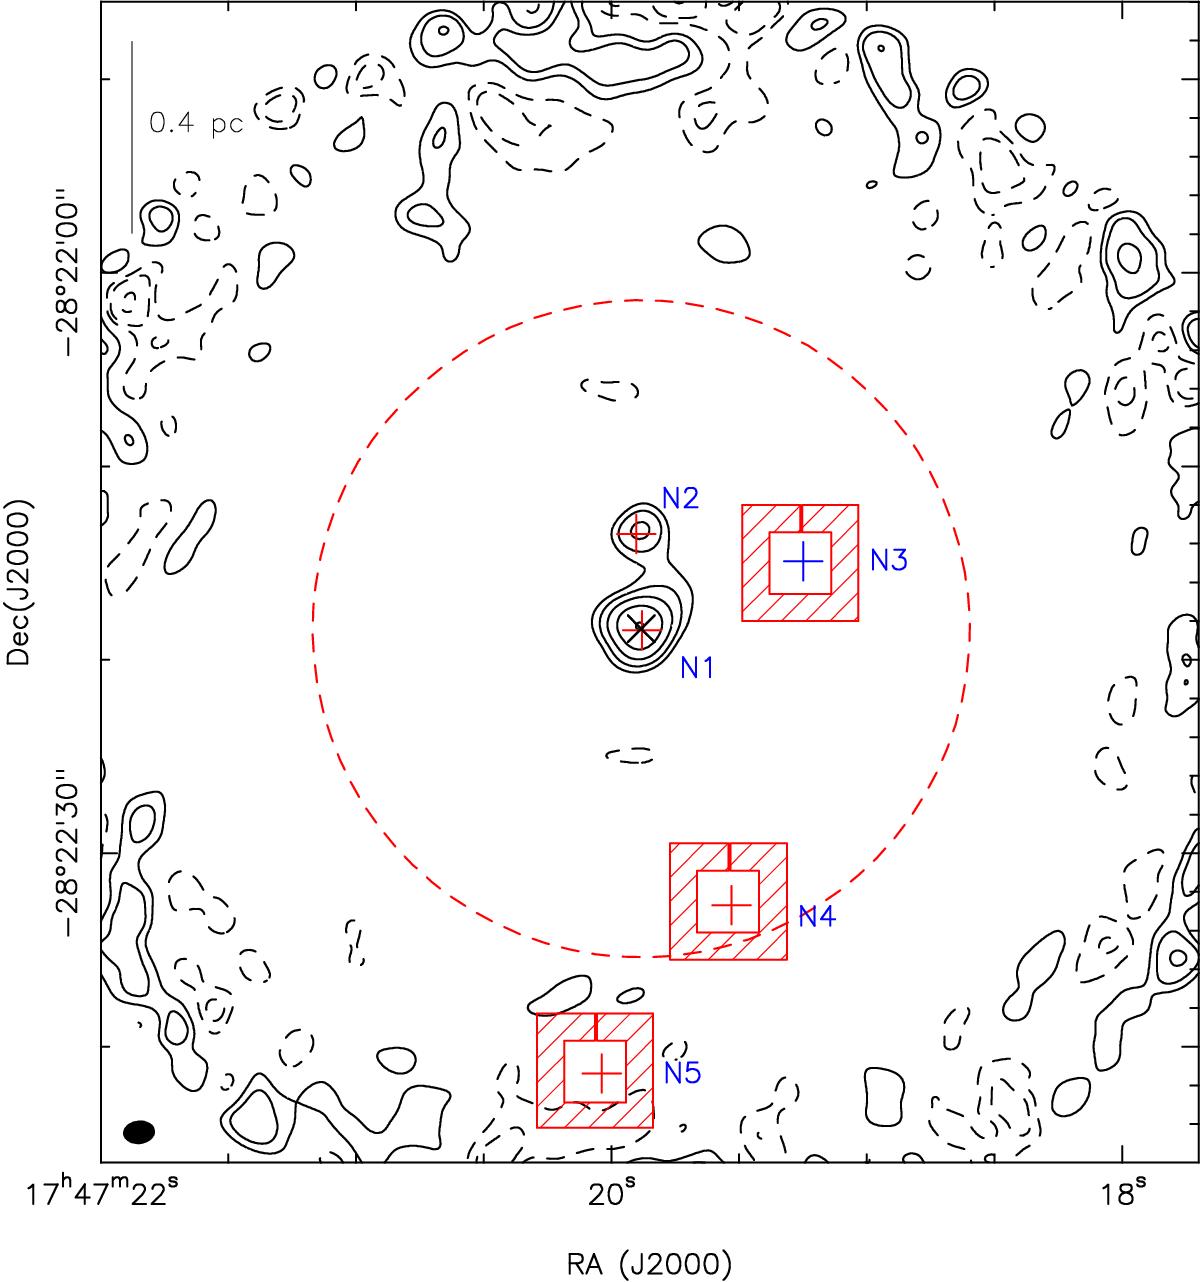
Continuum map of the Sgr B2(N) region obtained with the SMA at 343 GHz (Qin et al. 2011) and smoothed to the ALMA resolution. The new beam is shown in the bottom left corner (1.65″× 1.21″, PA = −83.4o). The contour levels (positive in solid line, negative in dashed line) start at 8σ and double up to 128σ with σ = 0.15 Jy/beam, the noise level measured inside the polygon defined around Sgr B2(N3). The black cross represents the SMA phase center. The red crosses mark the peak positions of the ALMA continuum emission derived from Fig. 2. The position of Sgr B2(N3) (blue cross) is derived from Fig. 1. The red dashed circle represents the size (HPBW) of the primary beam of the SMA 6 m antennas at 343 GHz. The map is corrected for the primary beam attenuation.
Current usage metrics show cumulative count of Article Views (full-text article views including HTML views, PDF and ePub downloads, according to the available data) and Abstracts Views on Vision4Press platform.
Data correspond to usage on the plateform after 2015. The current usage metrics is available 48-96 hours after online publication and is updated daily on week days.
Initial download of the metrics may take a while.