Fig. D.6
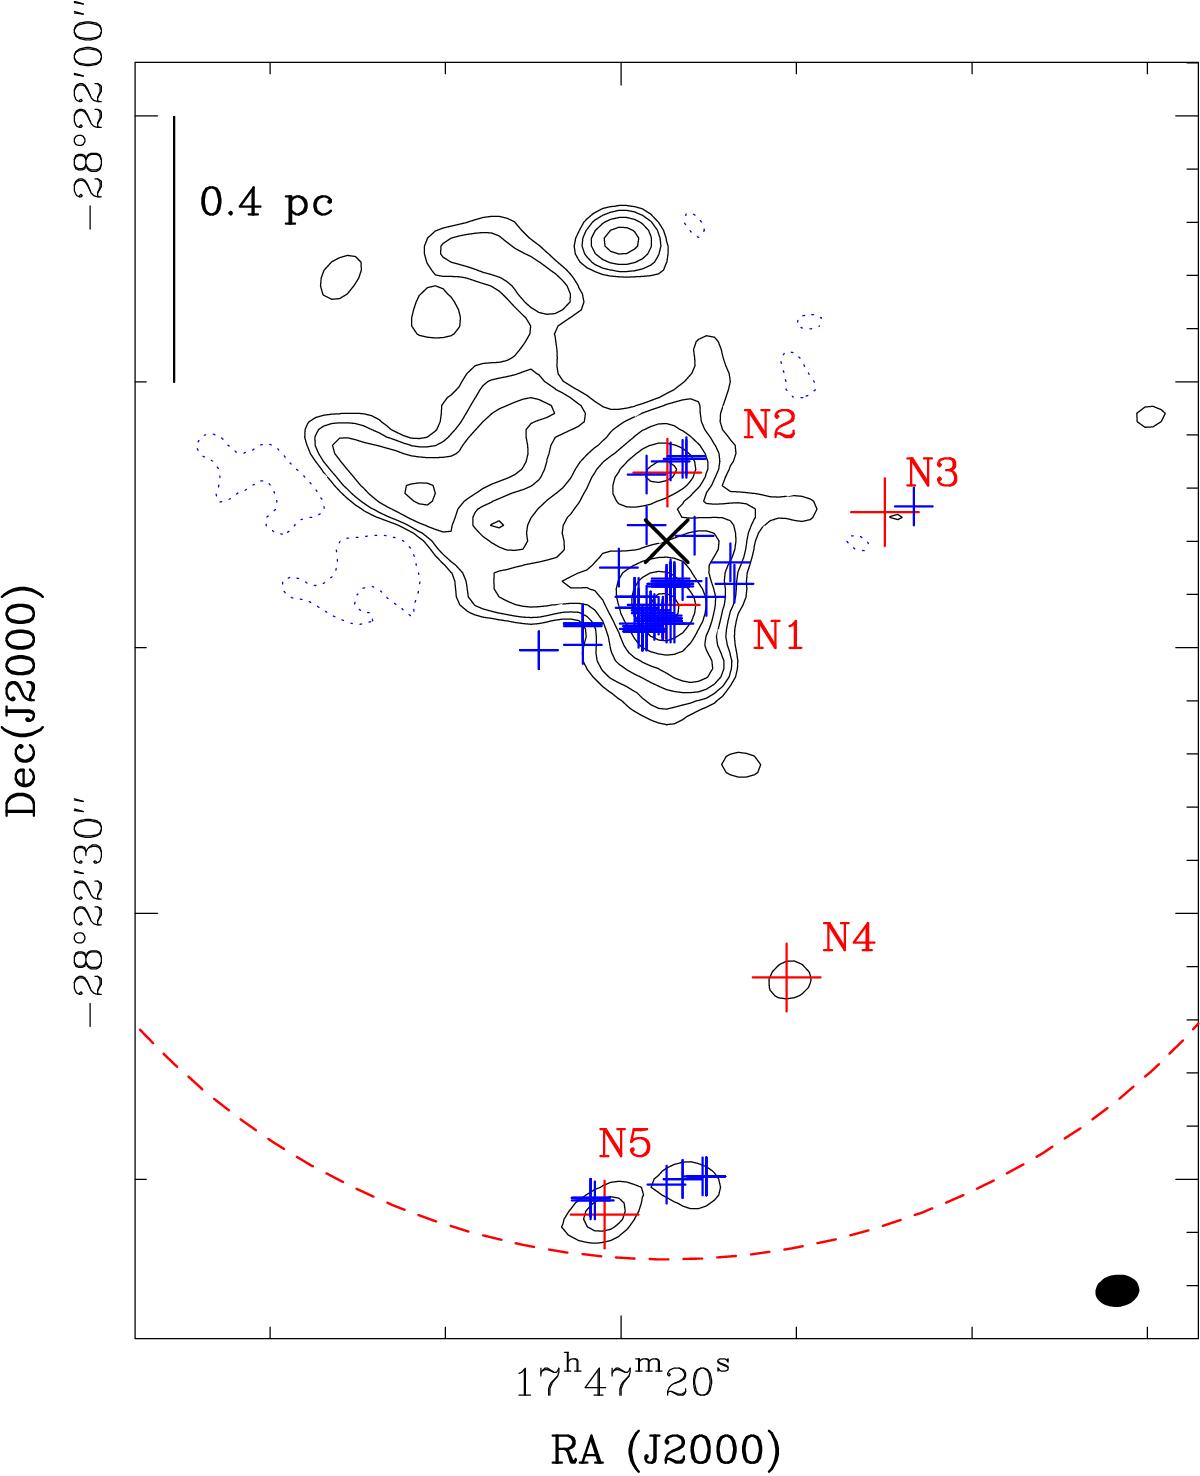
Continuum map of the Sgr B2(N) region obtained with ALMA at 108 GHz. Contour levels (positive in black solid line and negative in dashed line) start at five times the rms noise level, σ, of 3.0 mJy/beam and double in value up to 320σ. The filled ellipse shows the synthesized beam (1.65″× 1.21″, PA = −83.4o). The black cross represents the phase center. The red crosses mark the positions of the five hot cores embedded in Sgr B2(N). The blue crosses represent H2O masers (McGrath et al. 2004). The dotted red circle represents the size (HPBW) of the primary beam of the 12 m antennas at 108 GHz.
Current usage metrics show cumulative count of Article Views (full-text article views including HTML views, PDF and ePub downloads, according to the available data) and Abstracts Views on Vision4Press platform.
Data correspond to usage on the plateform after 2015. The current usage metrics is available 48-96 hours after online publication and is updated daily on week days.
Initial download of the metrics may take a while.