Fig. D.1
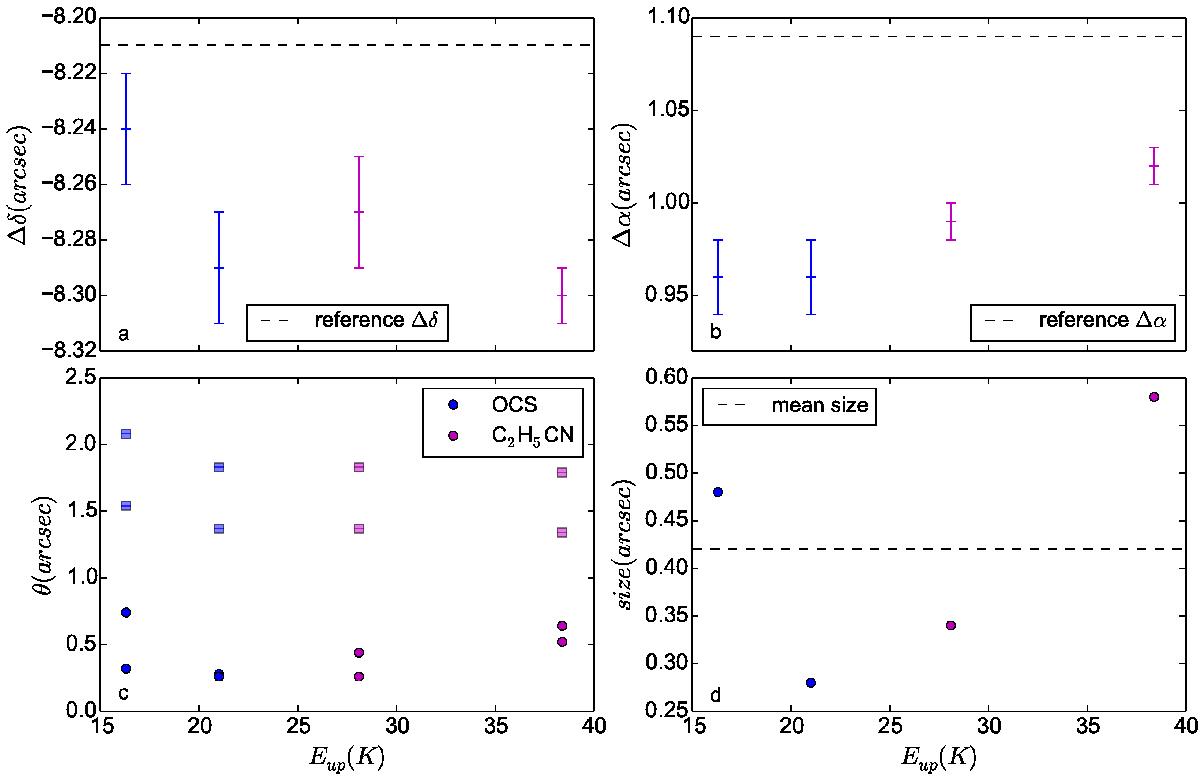
Results of the 2D-Gaussian fits to the integrated intensity maps showing resolved emission toward Sgr B2(N3). a), b) Fitted position. The error bars are the uncertainties given by the Gaussian fits. c), d) Fitted size. The dots represent the deconvolved major and minor diameters of the emission (c) and the resulting average source size (d). The squares represent the major and minor axes of the synthesized beam (c). The dashed lines represent the reference position of the hot core (a, b), and the mean deconvolved angular size (d).
Current usage metrics show cumulative count of Article Views (full-text article views including HTML views, PDF and ePub downloads, according to the available data) and Abstracts Views on Vision4Press platform.
Data correspond to usage on the plateform after 2015. The current usage metrics is available 48-96 hours after online publication and is updated daily on week days.
Initial download of the metrics may take a while.