Free Access
Fig. A.2
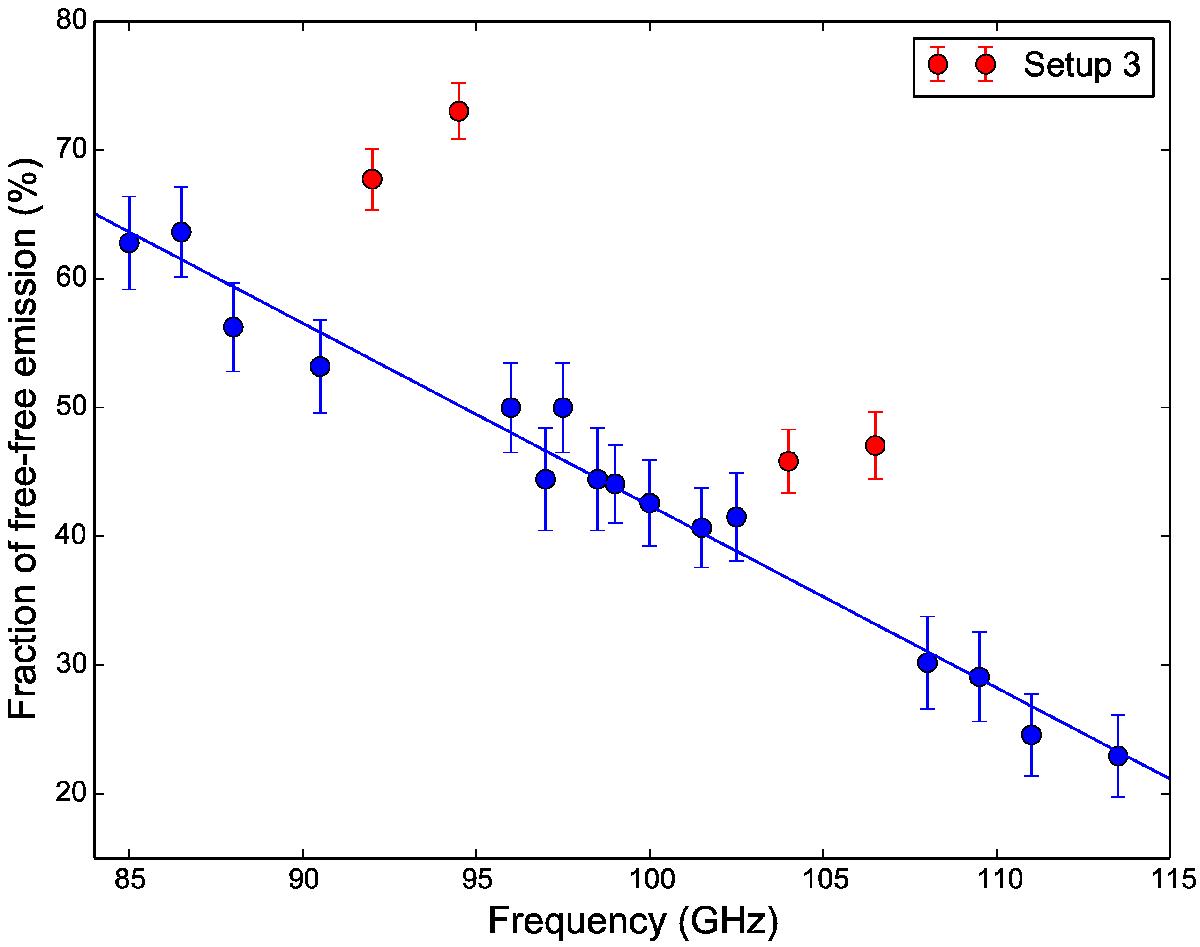
Fraction of free-free emission relative to the total flux density measured toward Sgr B2(N2). This does not include the contribution of K7. The blue line is the weighted linear fit to the results excluding setup 3 that is shown in red.
Current usage metrics show cumulative count of Article Views (full-text article views including HTML views, PDF and ePub downloads, according to the available data) and Abstracts Views on Vision4Press platform.
Data correspond to usage on the plateform after 2015. The current usage metrics is available 48-96 hours after online publication and is updated daily on week days.
Initial download of the metrics may take a while.