Fig. A.1
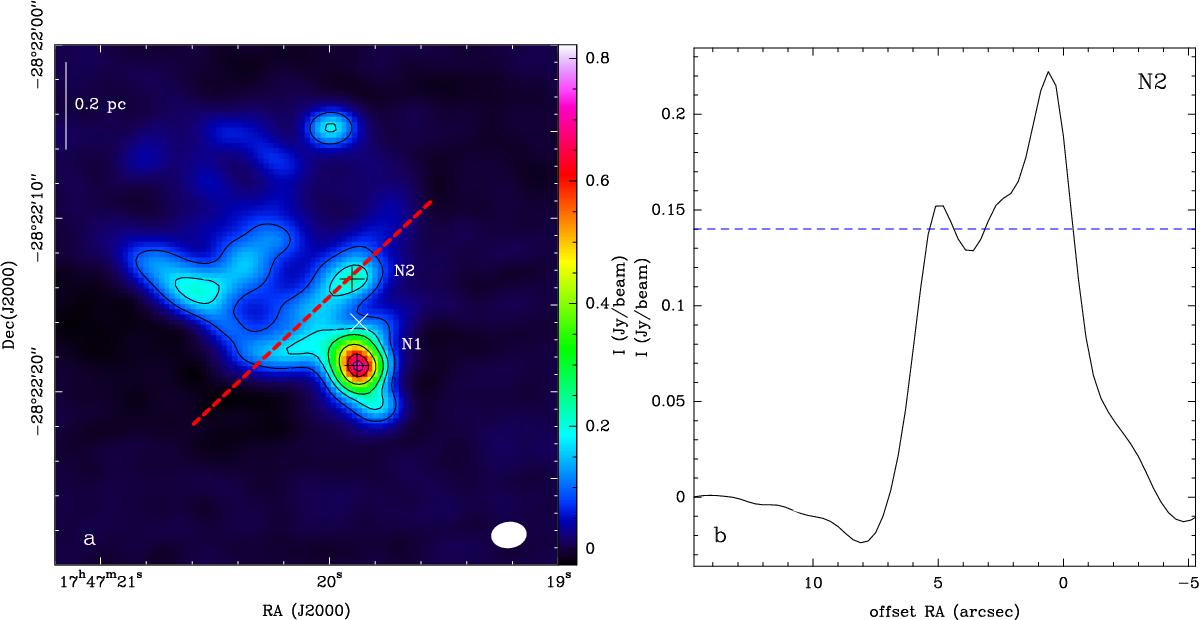
a) Continuum map obtained at 86.5 GHz with ALMA. The contour levels are 20σ, 40σ, 60σ, 100σ, 140σ, and 160σ, with σ = 4.3 mJy. The black crosses mark the peak positions of the continuum emission observed toward Sgr B2(N1) and Sgr B2(N2) derived from Fig. 2. The white cross represents the phase center. The filled ellipse shows the clean beam (2.04″× 1.51″, PA = −83.3o). b) Profile of the continuum emission along the direction plotted in red in panel a. The blue line marks the estimated level of free-free emission.
Current usage metrics show cumulative count of Article Views (full-text article views including HTML views, PDF and ePub downloads, according to the available data) and Abstracts Views on Vision4Press platform.
Data correspond to usage on the plateform after 2015. The current usage metrics is available 48-96 hours after online publication and is updated daily on week days.
Initial download of the metrics may take a while.