Free Access
Fig. 13
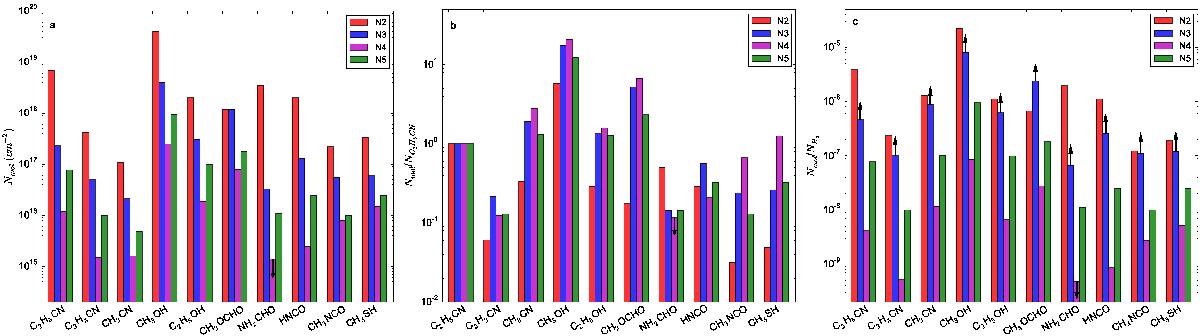
a) Column densities of various molecules detected toward four of the five hot cores embedded in Sgr B2(N) (see Table 10). b) Column densities normalized to the column density of C2H5CN. c) Chemical abundances with respect to H2. In each panel, lower and upper limits are indicated with arrows.
This figure is made of several images, please see below:
Current usage metrics show cumulative count of Article Views (full-text article views including HTML views, PDF and ePub downloads, according to the available data) and Abstracts Views on Vision4Press platform.
Data correspond to usage on the plateform after 2015. The current usage metrics is available 48-96 hours after online publication and is updated daily on week days.
Initial download of the metrics may take a while.