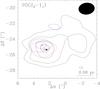
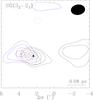
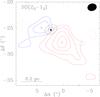
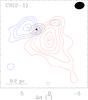
Fig. 12
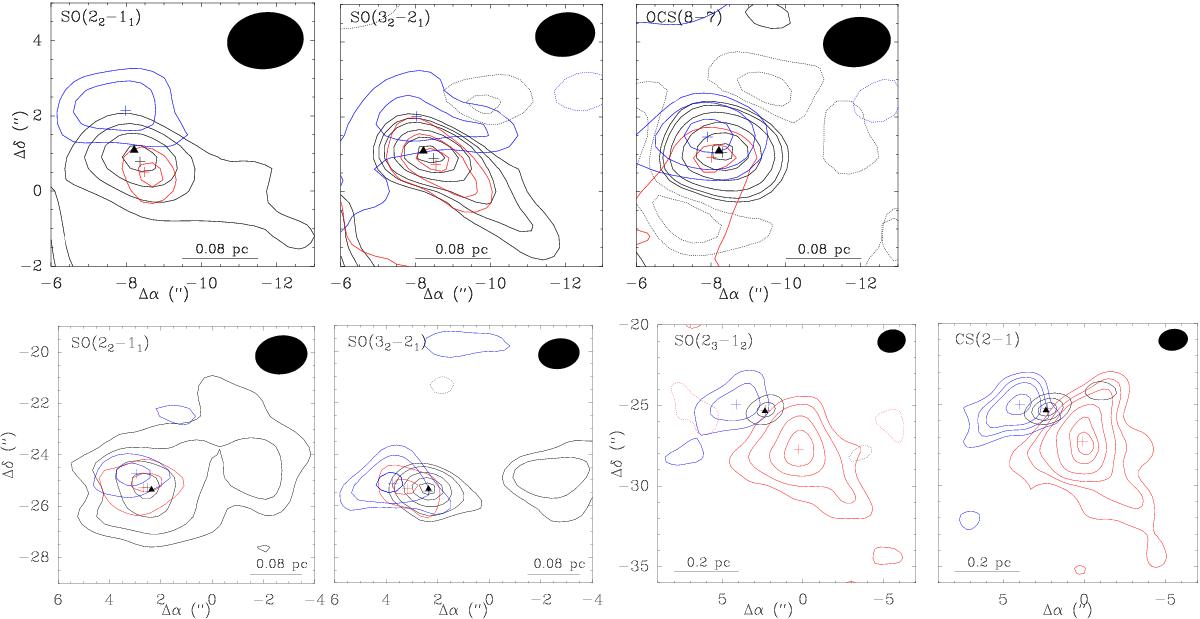
Integrated intensity maps of the lines shown in Fig. 11 toward Sgr B2(N3) (top row) and Sgr B2(N5) (bottom row). In each panel, maps of the blue- and red-shifted wings are presented in blue and red contours, respectively, overlaid on the integrated emission of the line core (black contours). For the line cores affected by absorption, the black contours represent the continuum emission. Rms noise levels and contour levels used for each map are listed in Table 9. Each cross corresponds to the peak position of the emission. The black triangle marks the position of the hot core (Sgr B2(N3) or Sgr B2(N5)) derived from Fig. 1.
Current usage metrics show cumulative count of Article Views (full-text article views including HTML views, PDF and ePub downloads, according to the available data) and Abstracts Views on Vision4Press platform.
Data correspond to usage on the plateform after 2015. The current usage metrics is available 48-96 hours after online publication and is updated daily on week days.
Initial download of the metrics may take a while.