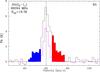
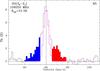
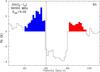
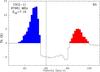
Fig. 11
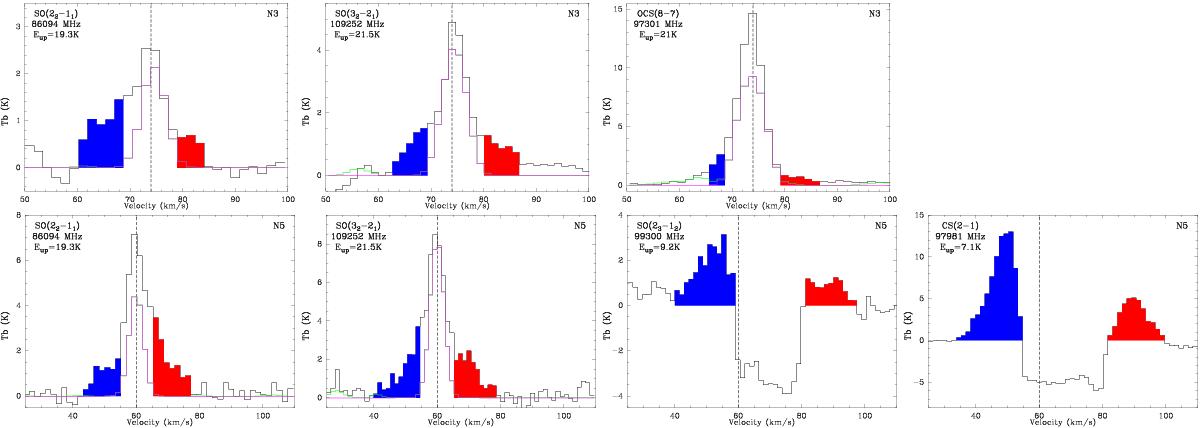
Spectra of the lines investigated to search for outflows toward Sgr B2(N3) (top row) and Sgr B2(N5) (bottom row). The dashed vertical line marks the systemic velocity of the source and the high velocity wings are highlighted in blue and red. The magenta spectrum represents our best-fit model while the green spectrum shows the model that contains all the identified species. The rest frequency and upper level energy (in temperature units) of each transition are indicated in each panel.
Current usage metrics show cumulative count of Article Views (full-text article views including HTML views, PDF and ePub downloads, according to the available data) and Abstracts Views on Vision4Press platform.
Data correspond to usage on the plateform after 2015. The current usage metrics is available 48-96 hours after online publication and is updated daily on week days.
Initial download of the metrics may take a while.