Fig. 1
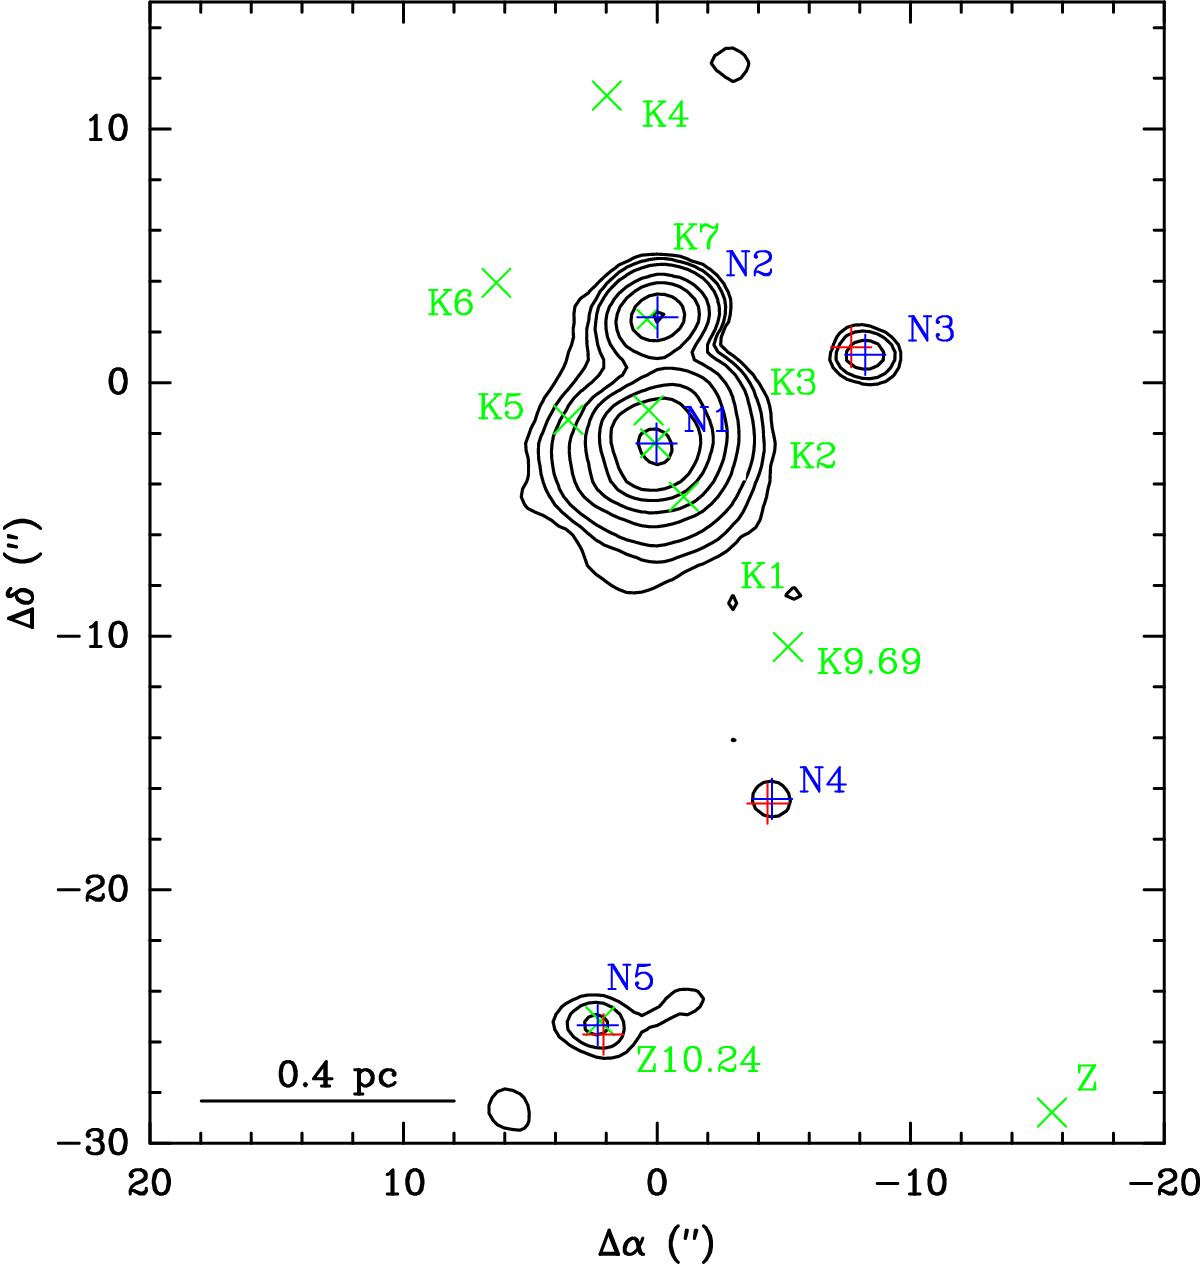
Contour map of the number of channels with continuum-subtracted flux density above the 7σ level (1σ ~ 3 mJy/beam). The contour levels are: 500, 1000, 2000, 5000, 10 000, 20 000, 30 000, and 40 000. The blue crosses mark the peaks of spectral line density. Red crosses represent the 6.7 GHz class II methanol masers (Caswell 1996). Green crosses represent the compact and ultra-compact HII regions (Gaume et al. 1995; De Pree et al. 2015). The offsets are defined with respect to the phase center (see Sect. 2.1).
Current usage metrics show cumulative count of Article Views (full-text article views including HTML views, PDF and ePub downloads, according to the available data) and Abstracts Views on Vision4Press platform.
Data correspond to usage on the plateform after 2015. The current usage metrics is available 48-96 hours after online publication and is updated daily on week days.
Initial download of the metrics may take a while.