Fig. 10
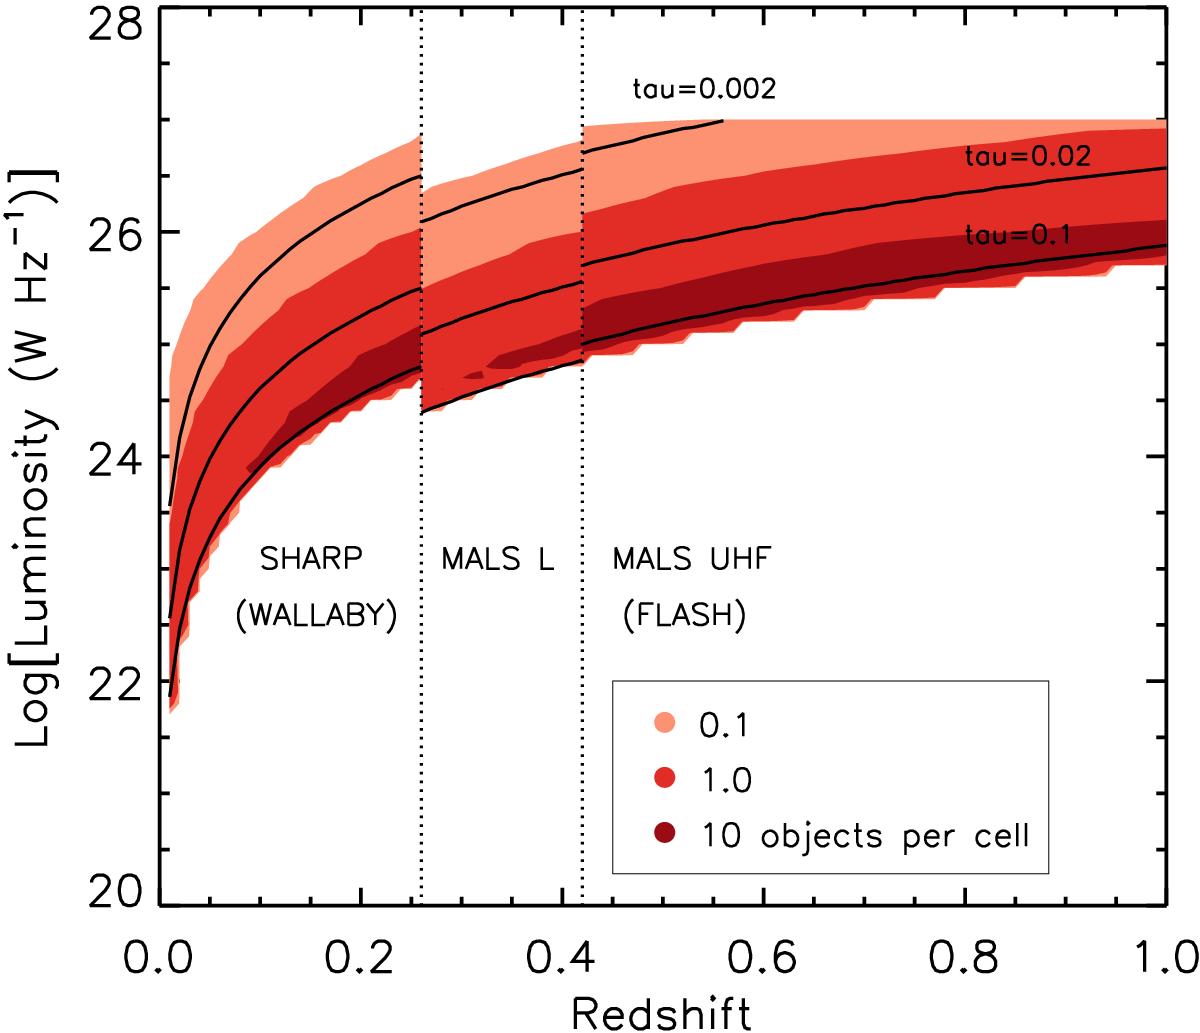
Coverage of the luminosity–redshift plane by upcoming absorption surveys. The parameter space is divided into cells of dz = 0.01 and dL = 0.1, and the colour coding indicates 0.1 (light), 1 (medium), and 10 (dark shading) objects per cell. As expected, the majority of objects lie close to the flux limits of the surveys. At z ≤ 0.26, SHARP in the northern hemisphere and WALLABY in the south cover very similar parameter space. The full MALS L-band survey covers 0 < z < 0.58, but is the only survey probing intermediate redshifts, 0.26 < z < 0.42. MALS UHF targets intermediate redshifts, 0.42 < z < 1. A similar redshift range is covered by FLASH, but with brighter flux limits. For clarity, we show the coverage of the plane out to z = 1, even though both surveys extend to z = 1.44 with the same behaviour. The black lines denote the minimum optical depth visible for sources of a given flux with the channel rms values given in Table 3.
Current usage metrics show cumulative count of Article Views (full-text article views including HTML views, PDF and ePub downloads, according to the available data) and Abstracts Views on Vision4Press platform.
Data correspond to usage on the plateform after 2015. The current usage metrics is available 48-96 hours after online publication and is updated daily on week days.
Initial download of the metrics may take a while.