Fig. 3
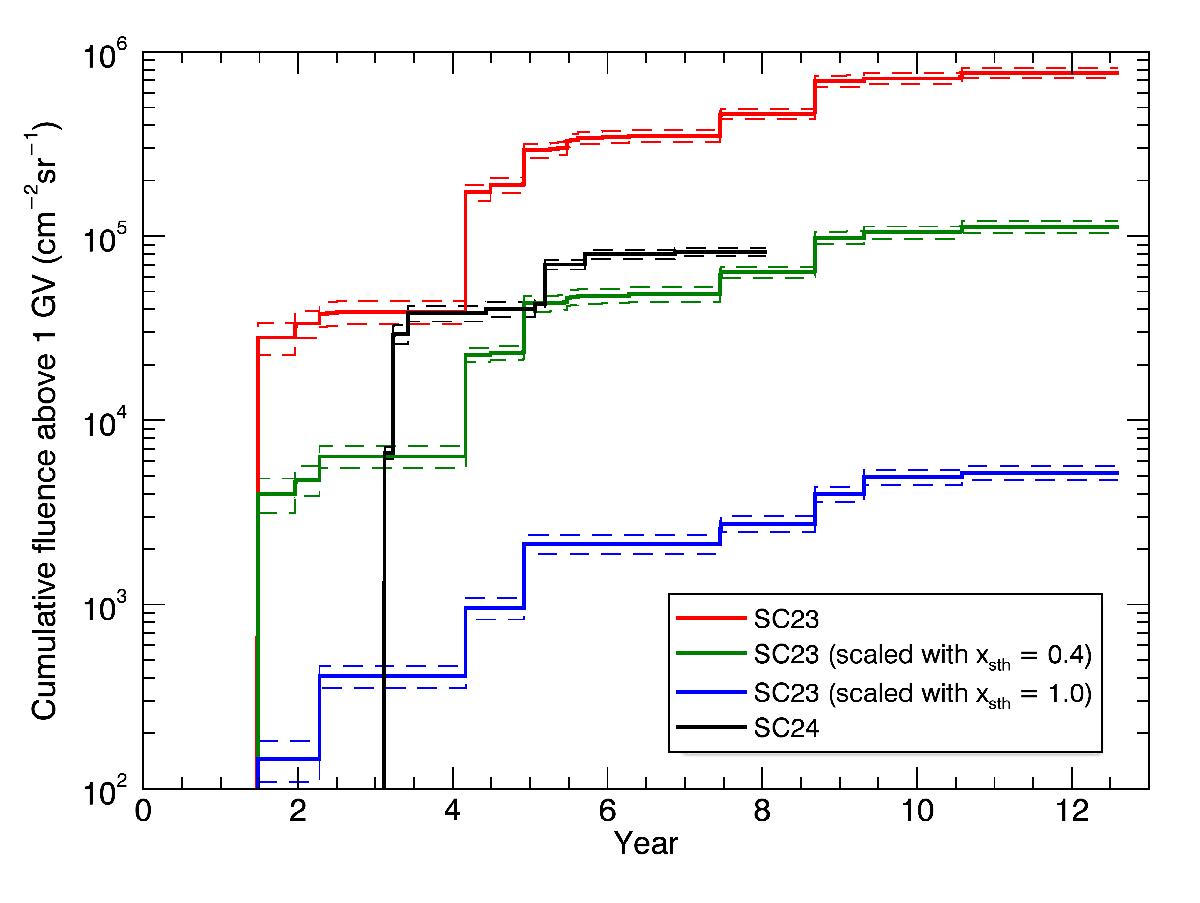
Total cumulative >1 GV proton fluence of the GLEs and sub-GLEs of SC 23 (red polyline) plotted as a function of time since the start of the SC; the same GLE fluence plotted by scaling the parameters J0 and R0 to the values representing SC 24 assuming an entirely suprathermal seed population (blue polyline); and the true cumulative GLE fluence of SC 24 (black polyline). The green polyline is the scaled fluence assuming that the seed population consists of 40% of suprathermals. The 1σ uncertainties are given as dashed polylines around each of the cumulative fluence polylines.
Current usage metrics show cumulative count of Article Views (full-text article views including HTML views, PDF and ePub downloads, according to the available data) and Abstracts Views on Vision4Press platform.
Data correspond to usage on the plateform after 2015. The current usage metrics is available 48-96 hours after online publication and is updated daily on week days.
Initial download of the metrics may take a while.