Fig. 1
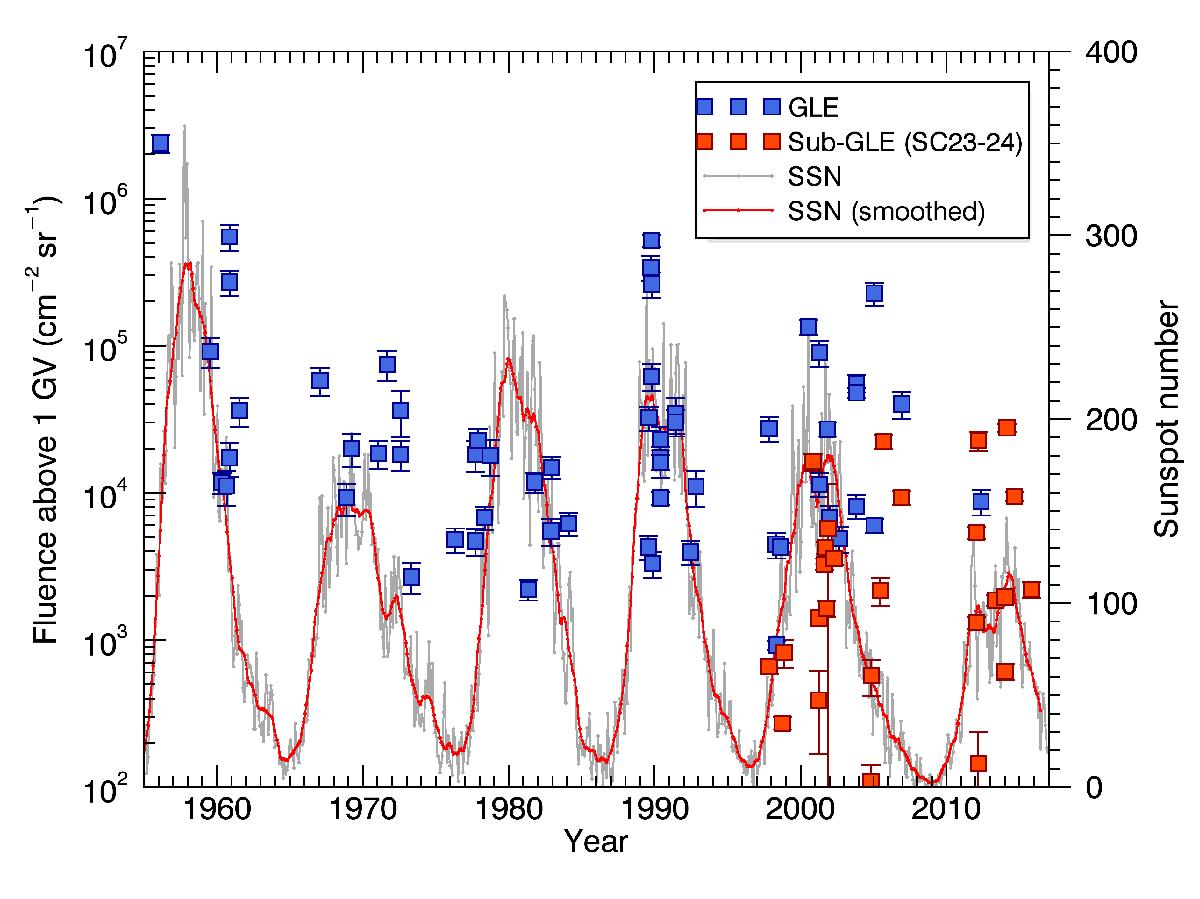
Monthly mean (gray) and the 13-month gliding averaged (red) sunspot number and the >1-GV fluences of all GLEs observed since 1956 (blue boxes) for which the NM statistics allows the determination of the spectral parameters of fluence. The >1-GV fluences of sub-GLEs of SC 23 and 24 (see Sect. 4.1) are included (red boxes) as well.
Current usage metrics show cumulative count of Article Views (full-text article views including HTML views, PDF and ePub downloads, according to the available data) and Abstracts Views on Vision4Press platform.
Data correspond to usage on the plateform after 2015. The current usage metrics is available 48-96 hours after online publication and is updated daily on week days.
Initial download of the metrics may take a while.