Fig. 12
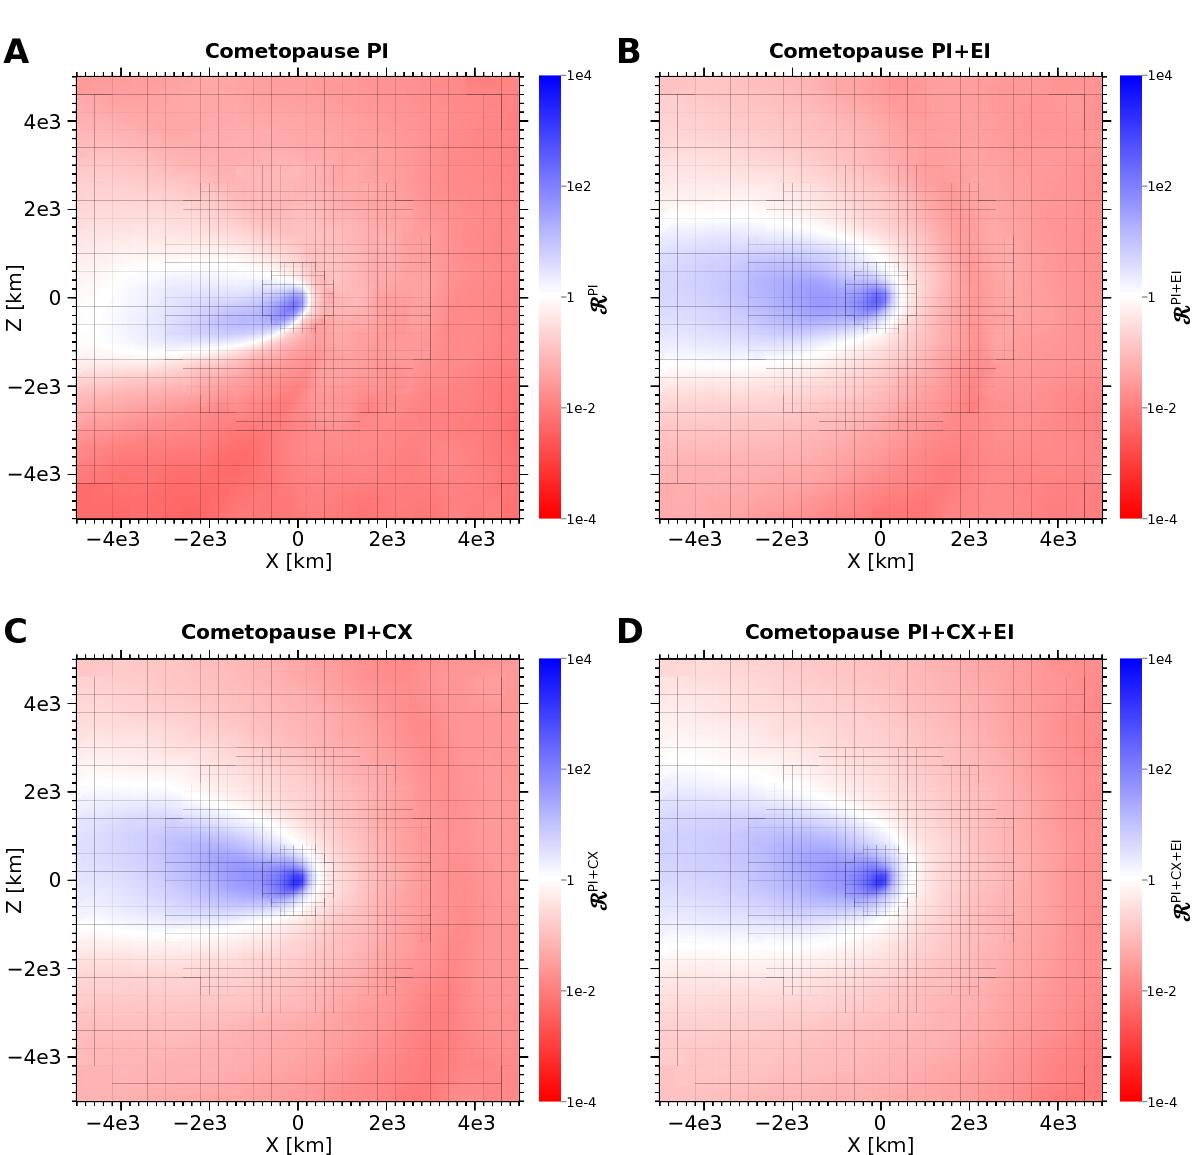
Ratio R of cometary ion density to solar wind density in the x − z plane, where the undisturbed convection electric field lies. A) Photoionisation only. B) Photoionisation + electron ionisation. C) Photoionisation + charge exchange. D) All processes. The cometopause location is seen as the thin white region between the blue (cometary ion-dominated) and red (solar wind-dominated) regions, defined here as the positions where R= 1. The bow shock can be seen as a darker red paraboloid region that corresponds to an increased solar wind density upstream of the cometopause.
Current usage metrics show cumulative count of Article Views (full-text article views including HTML views, PDF and ePub downloads, according to the available data) and Abstracts Views on Vision4Press platform.
Data correspond to usage on the plateform after 2015. The current usage metrics is available 48-96 hours after online publication and is updated daily on week days.
Initial download of the metrics may take a while.