Fig. 10
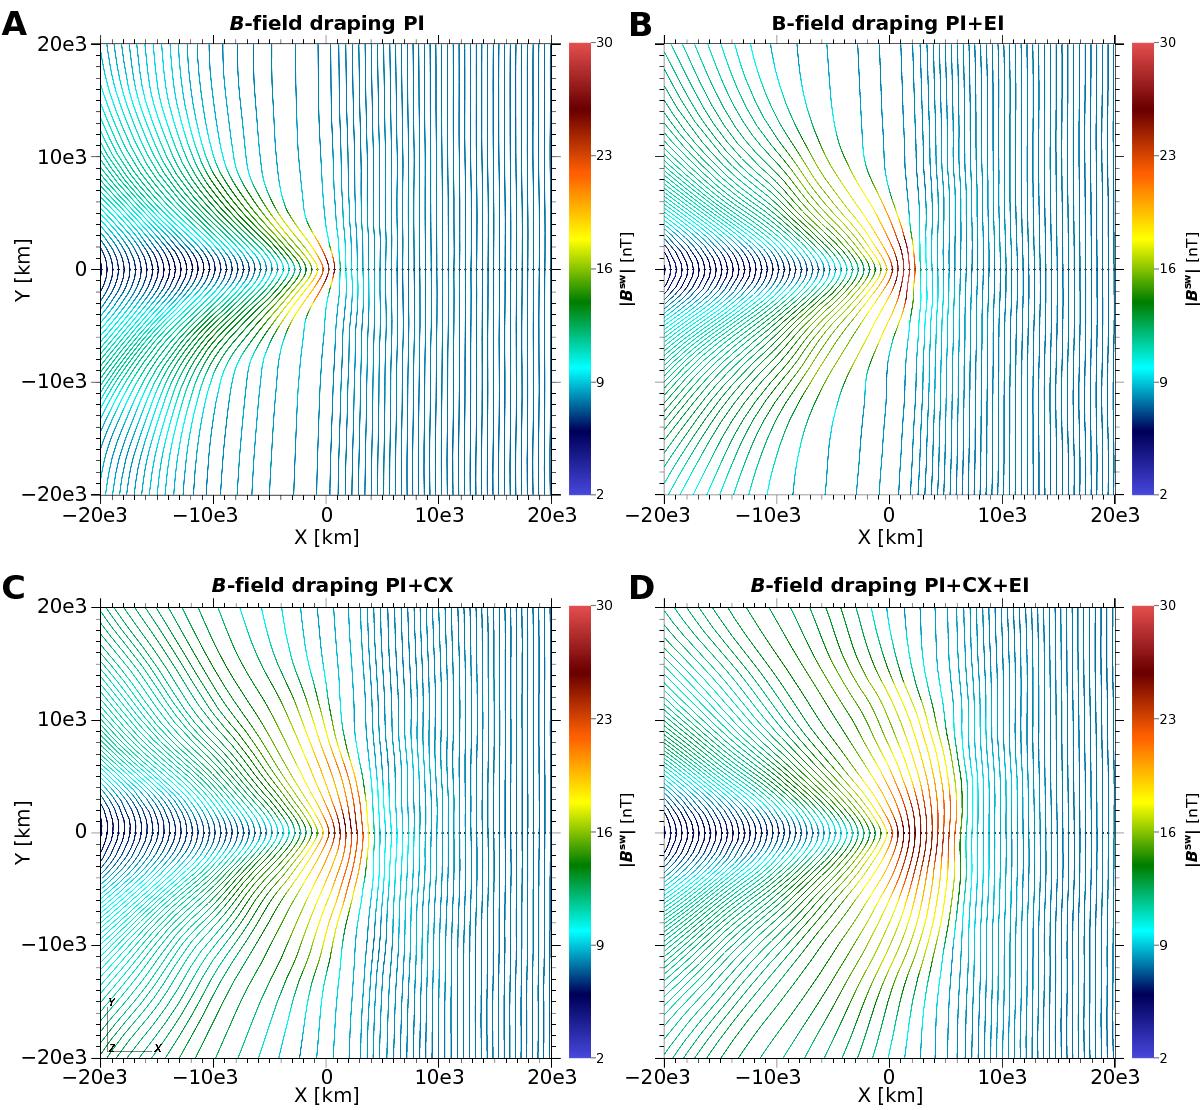
Magnetic field draping in the x − y plane in the analysed simulations. A) Photoionisation only. B) Photoionisation+electron ionisation. C) Photoionisation+charge exchange. D) All processes. The colour code shows the intensity of the magnetic field ranging from low (blue) to high intensity (red), with the same scale. The seed points for the field line tracing are shown as a horizontal dotted line along the x axis.
Current usage metrics show cumulative count of Article Views (full-text article views including HTML views, PDF and ePub downloads, according to the available data) and Abstracts Views on Vision4Press platform.
Data correspond to usage on the plateform after 2015. The current usage metrics is available 48-96 hours after online publication and is updated daily on week days.
Initial download of the metrics may take a while.