Free Access
Fig. 5
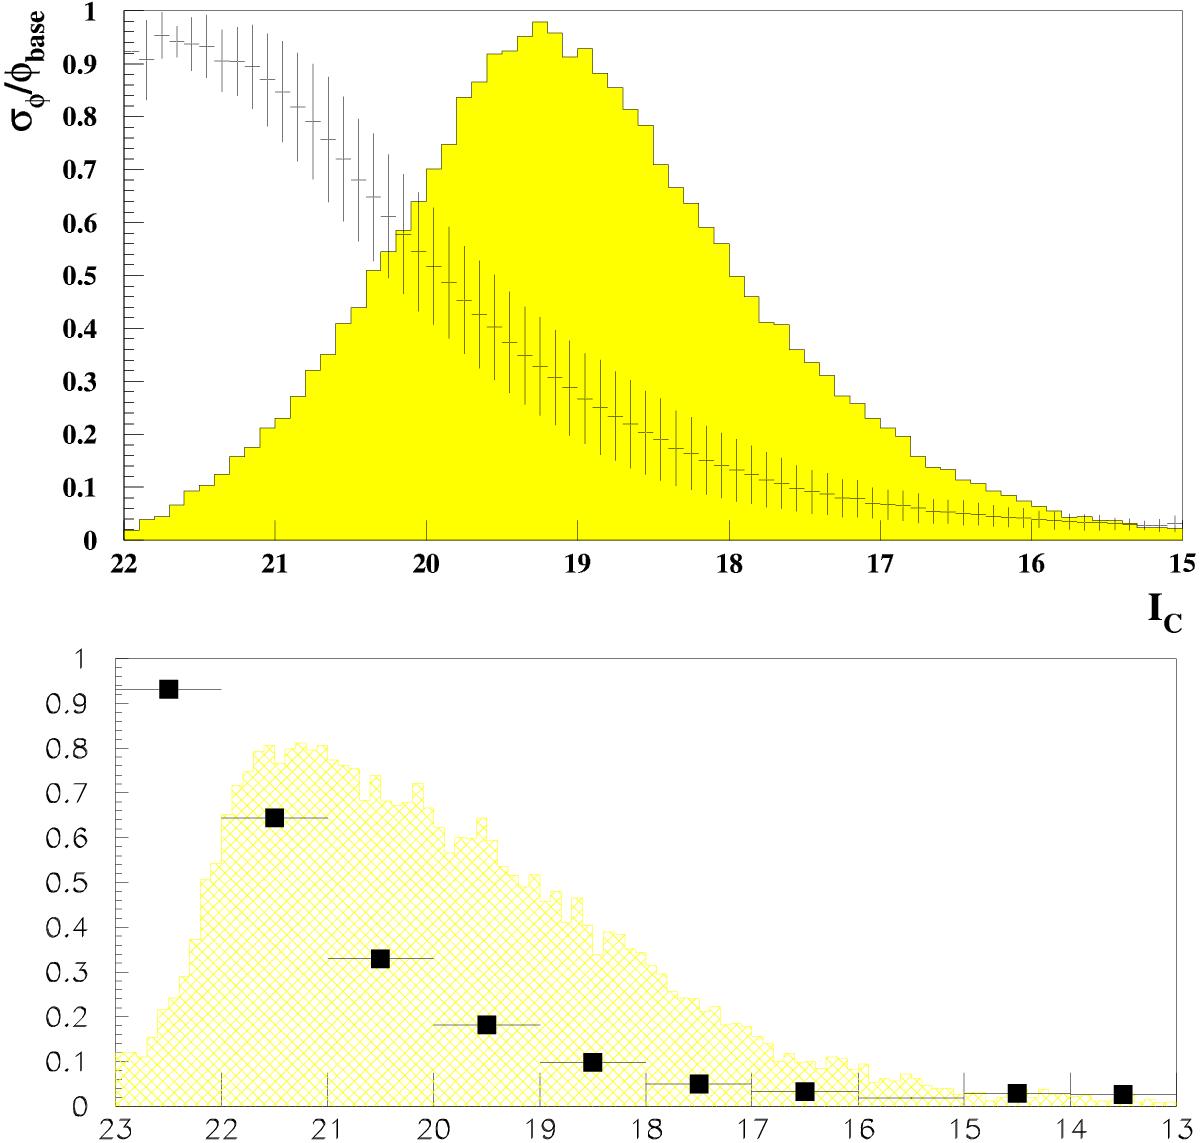
Photometric point-to-point precision along the EROS light-curves vs. REROS = I (upper) and BEROS (lower). Vertical bars in I show the dispersion of this precision in the EROS catalog. The histograms show the magnitude distribution of the full EROS spiral arm catalog (all directions).
This figure is made of several images, please see below:
Current usage metrics show cumulative count of Article Views (full-text article views including HTML views, PDF and ePub downloads, according to the available data) and Abstracts Views on Vision4Press platform.
Data correspond to usage on the plateform after 2015. The current usage metrics is available 48-96 hours after online publication and is updated daily on week days.
Initial download of the metrics may take a while.