Fig. A.2
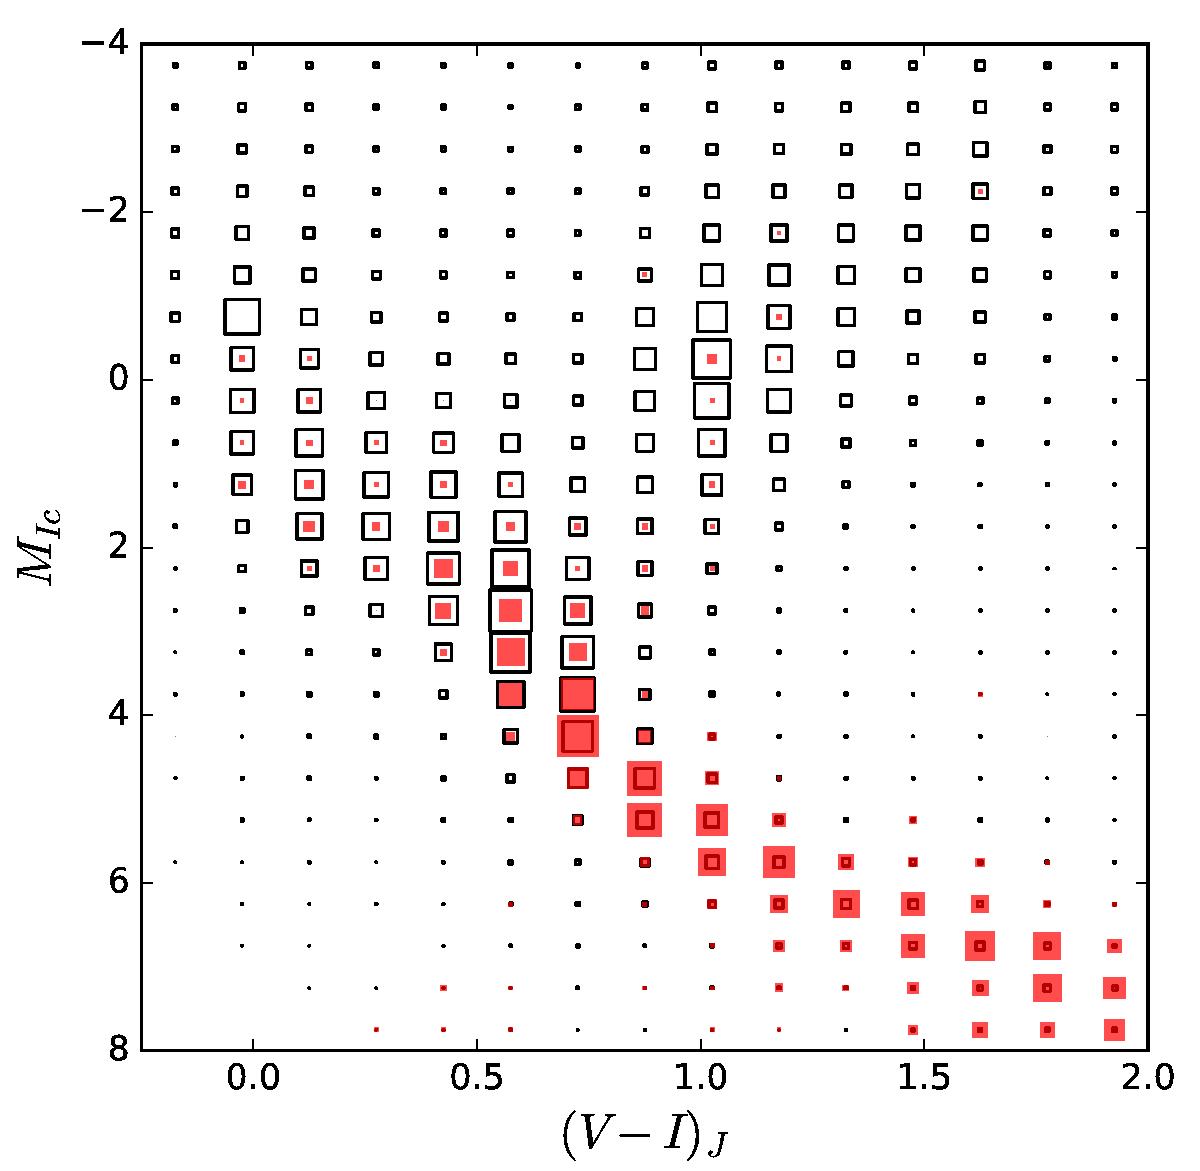
Hipparcos absolute color–magnitude diagram in MIC vs. (V − I)J. The black squares correspond to the full catalog (statistically biased). The red squares correspond to the subsample of stars closer than 50 pc; this subsample is statistically unbiased only for absolute magnitude MV< 4.0 (corresponding to MI< 3.1, above the horizontal line in the diagram). The size scales are different between the red and black squares for readability.
Current usage metrics show cumulative count of Article Views (full-text article views including HTML views, PDF and ePub downloads, according to the available data) and Abstracts Views on Vision4Press platform.
Data correspond to usage on the plateform after 2015. The current usage metrics is available 48-96 hours after online publication and is updated daily on week days.
Initial download of the metrics may take a while.