Fig. A.1
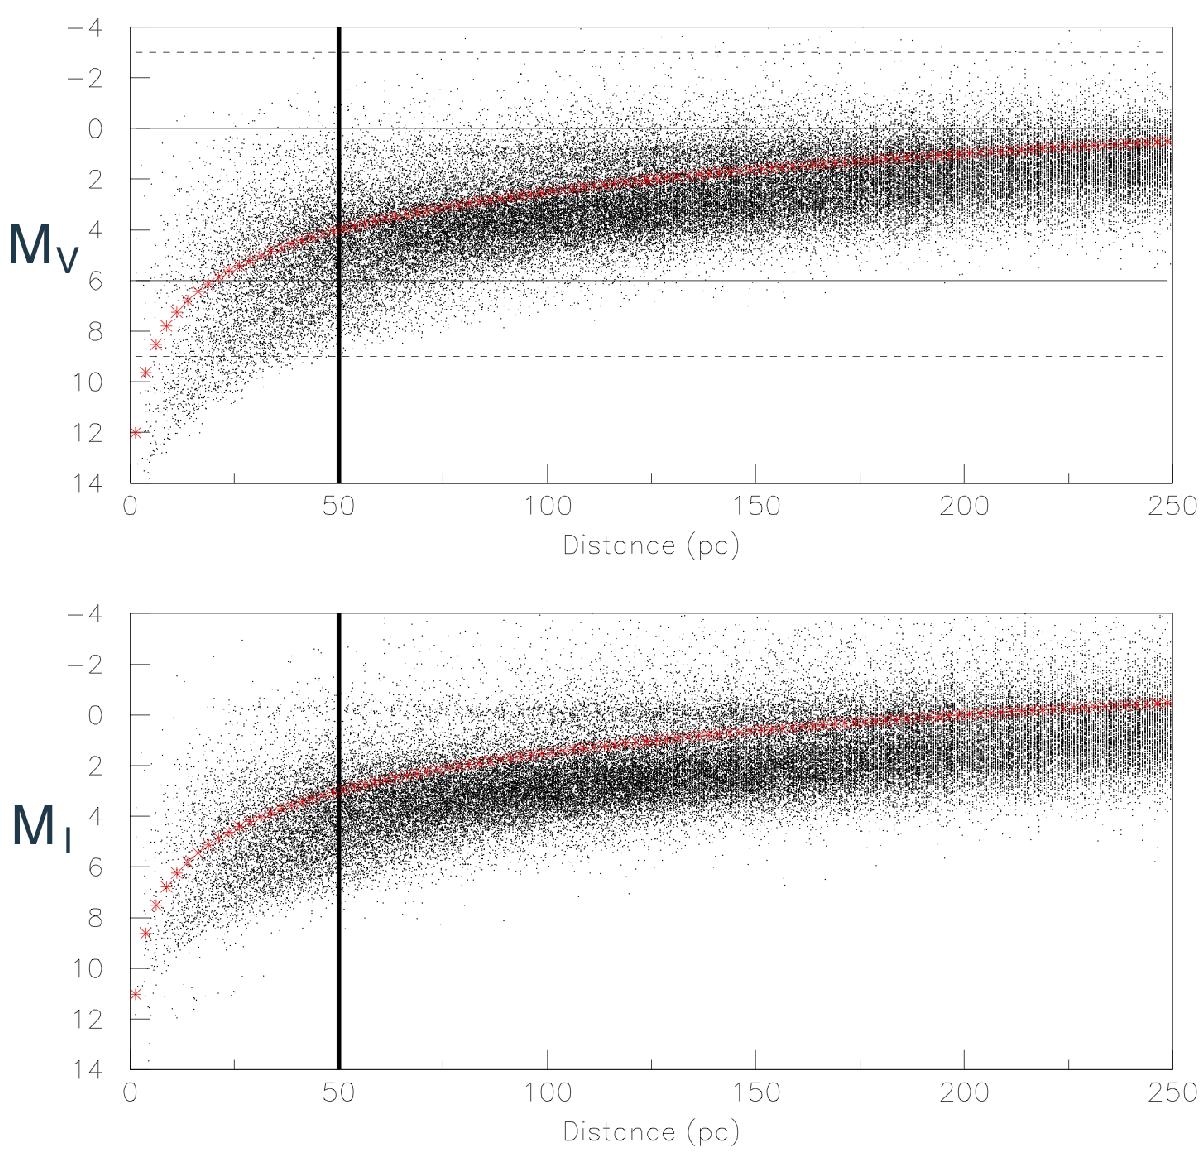
Hipparcos absolute magnitudes vs. distance distributions (up = MV, down = MI). The red curves indicate the absolute magnitude completeness limit as a function of the distance. The vertical line shows our distance limit to get the local stellar population. The horizontal full lines at MV = 0 and MV = 6 correspond to the domain that contains enough stars from the Hipparcos catalog to enable our debiasing procedure.
Current usage metrics show cumulative count of Article Views (full-text article views including HTML views, PDF and ePub downloads, according to the available data) and Abstracts Views on Vision4Press platform.
Data correspond to usage on the plateform after 2015. The current usage metrics is available 48-96 hours after online publication and is updated daily on week days.
Initial download of the metrics may take a while.