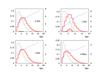
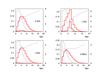
Fig. 12

Expected normalized distributions of the distances for the lensed sources – when taking into account the EROS microlensing detection efficiencies – (thin lines) and of the lenses (thick lines) from the simulation of our simple model (upper) and the Besançon model (lower). The sparsely-populated distributions around 4 kpc (for β Sct and γ Sct) correspond to the contribution of the bar objects. The dashed curves show, as a function of the distance, the average extinctions of the stars in the simulated EROS-like catalog (in V magnitude, on the right scale). It is strongly biased in favor of small extinctions mainly due to the magnitude selection I< 18.4.
Current usage metrics show cumulative count of Article Views (full-text article views including HTML views, PDF and ePub downloads, according to the available data) and Abstracts Views on Vision4Press platform.
Data correspond to usage on the plateform after 2015. The current usage metrics is available 48-96 hours after online publication and is updated daily on week days.
Initial download of the metrics may take a while.