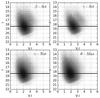
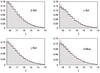
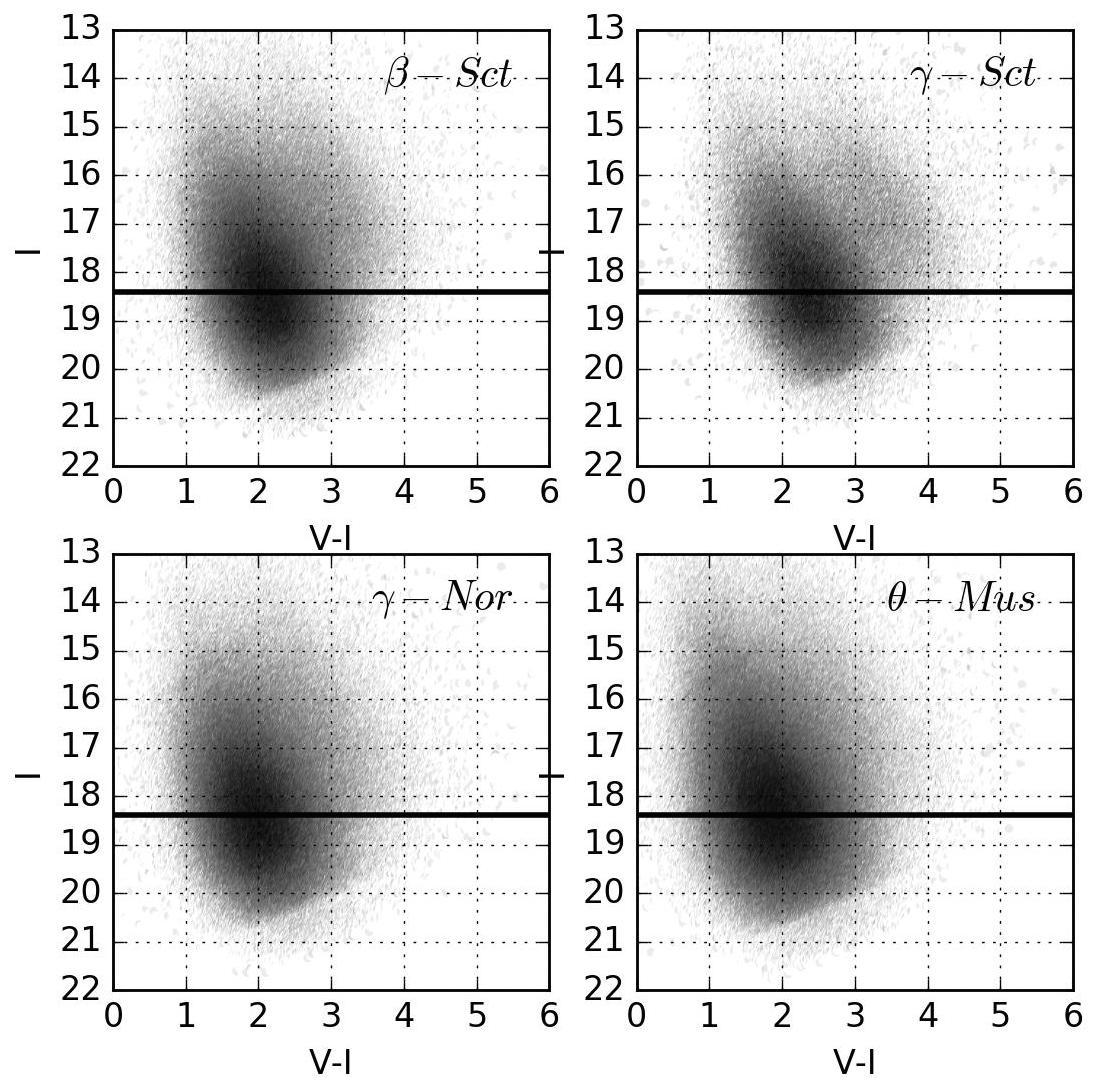
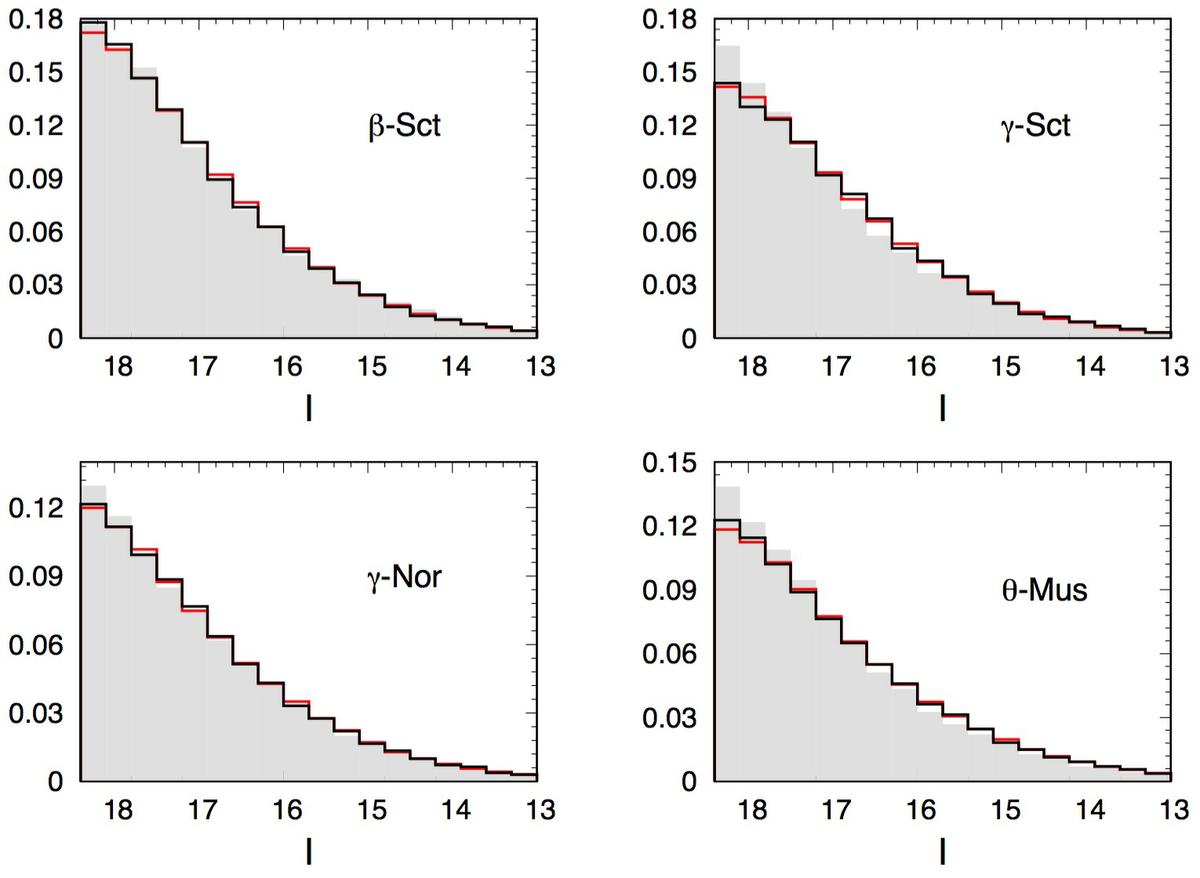
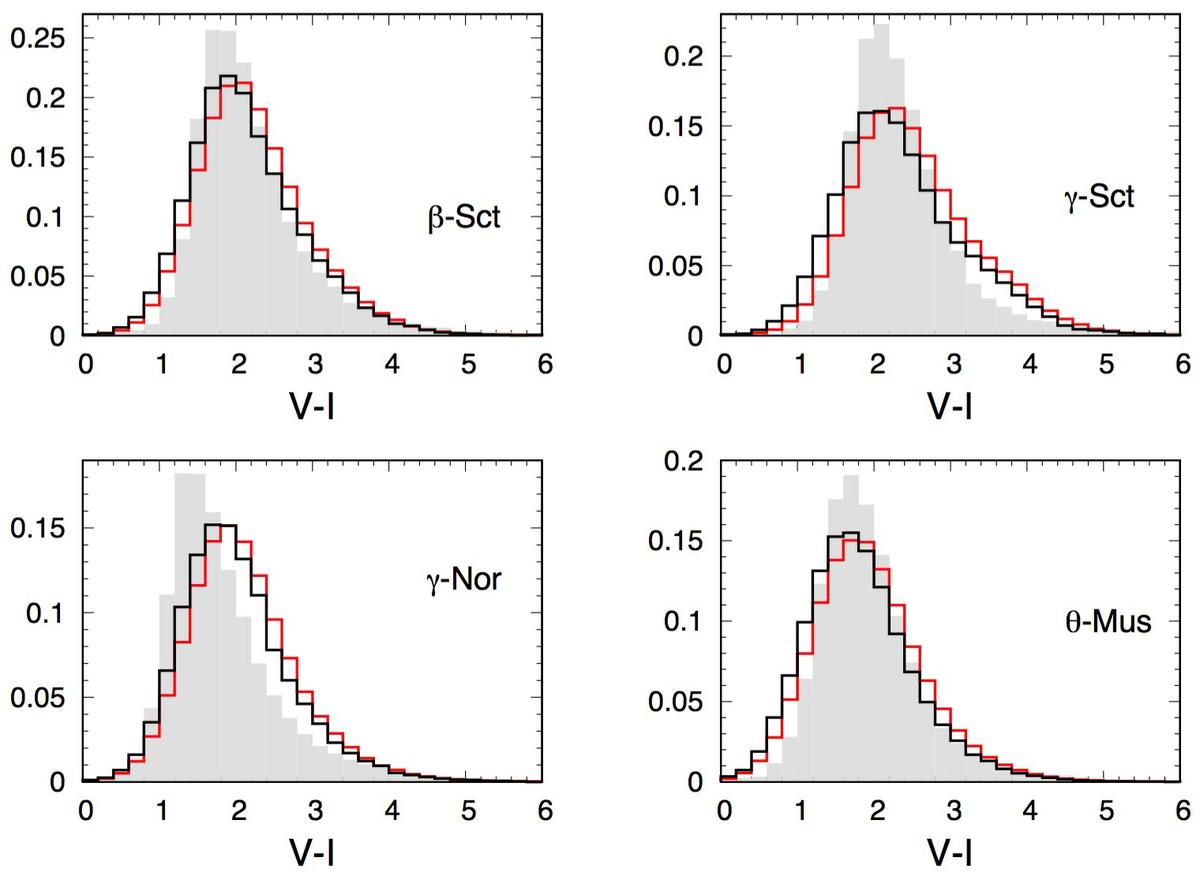
Fig. 10
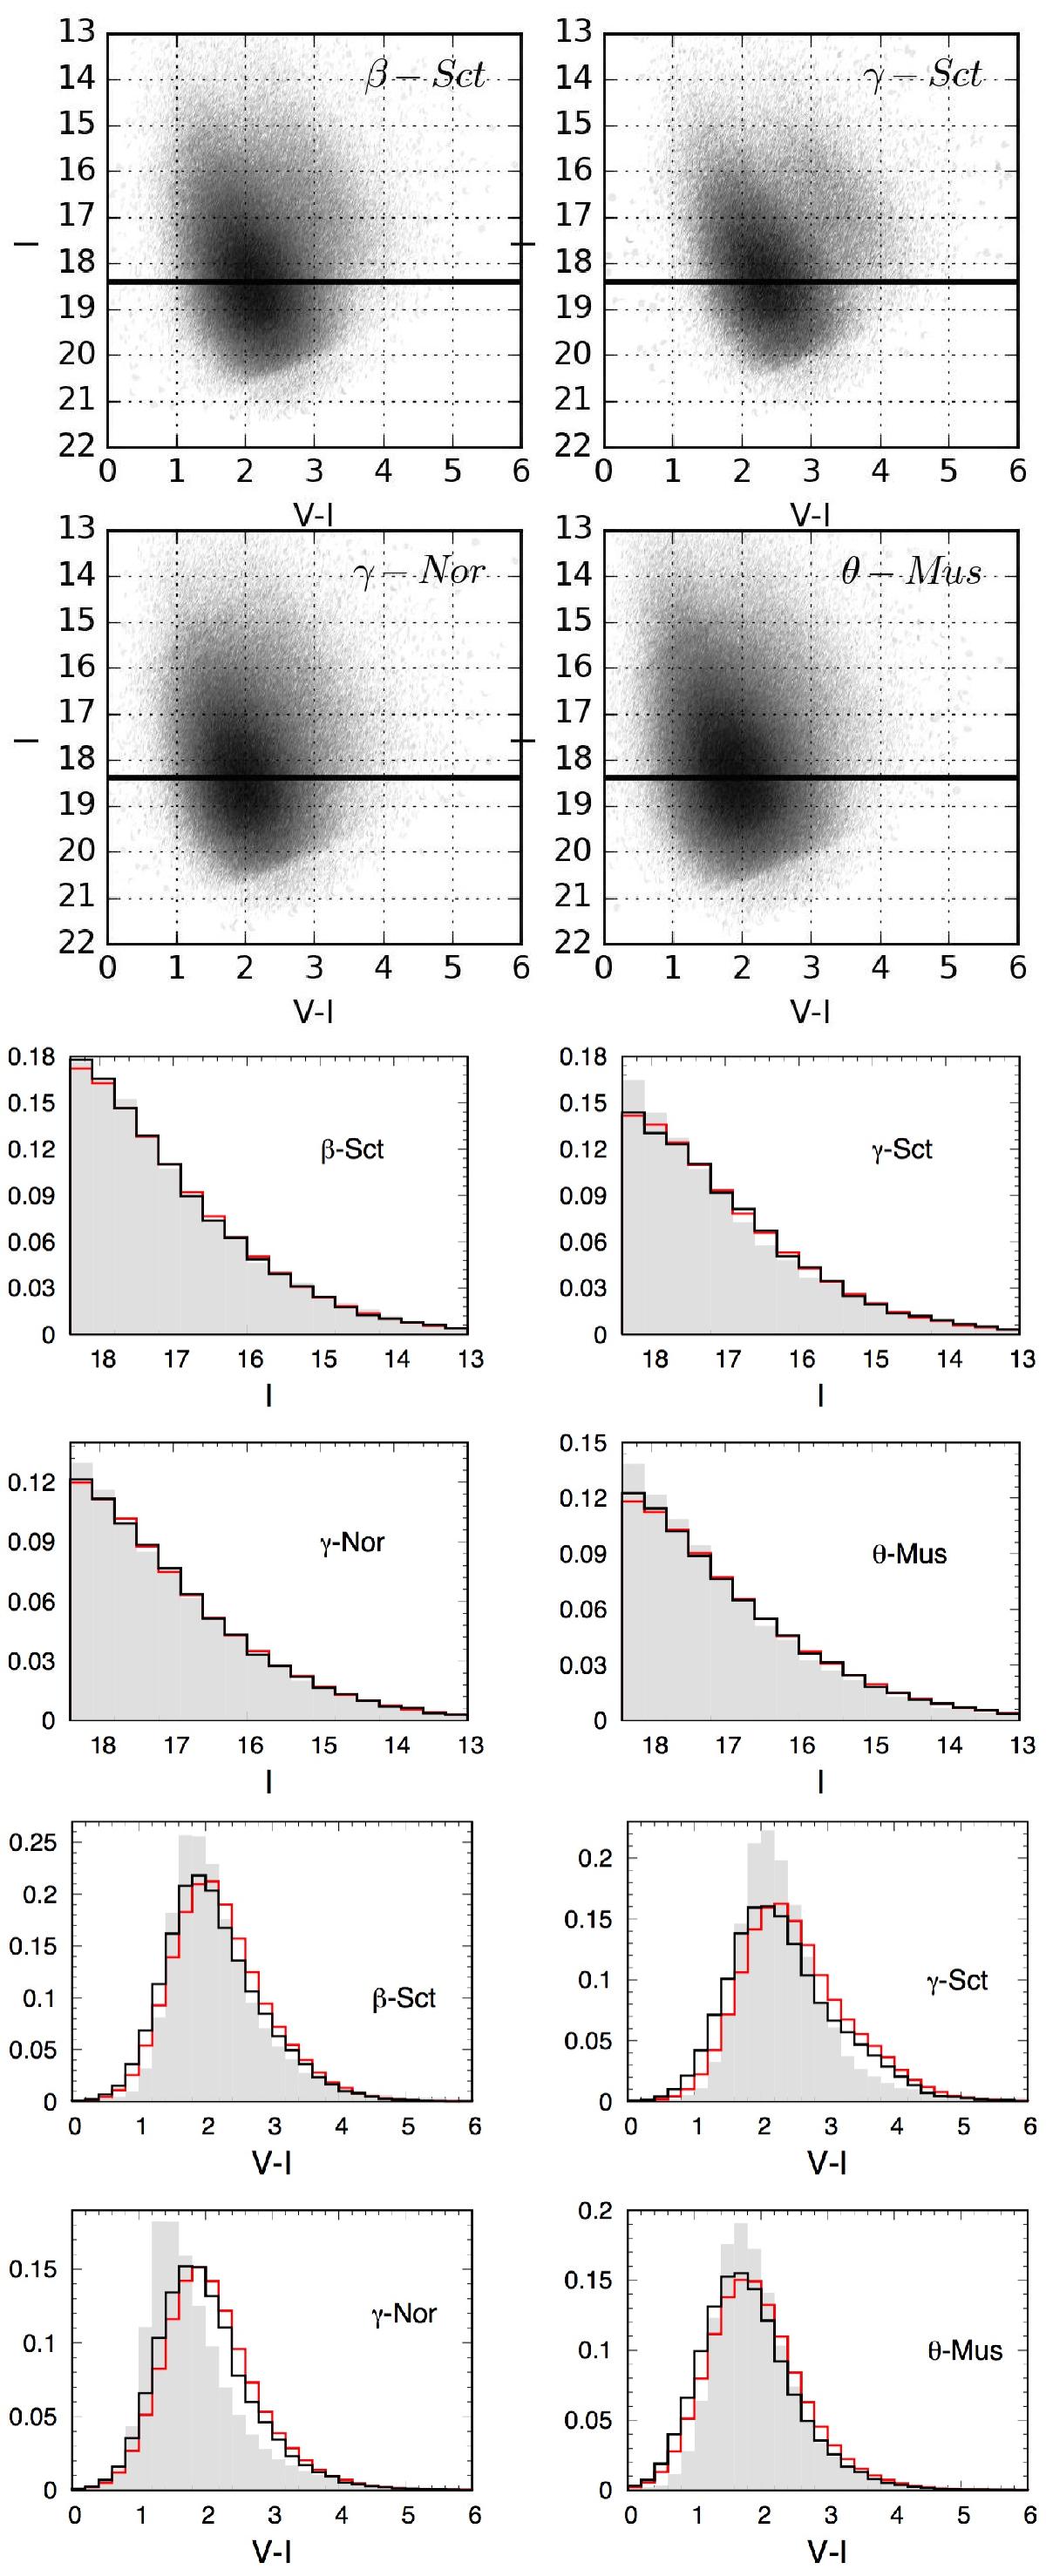
Simulated CMDs toward the 4 monitored directions (top) with the magnitude (middle) and color (bottom) projections for the stars brighter than I = 18.4, expressed in million of stars per square degree per magnitude. Results from our simple model are plotted with black lines and results from the Besançon model with red lines; the distributions of the EROS observed populations of bright stars (I< 18.4) are superimposed on the projections as light gray histograms.
Current usage metrics show cumulative count of Article Views (full-text article views including HTML views, PDF and ePub downloads, according to the available data) and Abstracts Views on Vision4Press platform.
Data correspond to usage on the plateform after 2015. The current usage metrics is available 48-96 hours after online publication and is updated daily on week days.
Initial download of the metrics may take a while.